The basic principles about how dollars are impacted by compound interest and present value calculations can be used to make better business decisions. There are a number of alternative methods for evaluating capital budgeting decisions. These include net present value, accounting rate of return, internal rate of return, and payback.
Net Present Value
The net present value (NPV) method offsets the present value of an investment’s cash inflows against the present value of the cash outflows. Present value amounts are computed using a firm’s assumed cost of capital. The cost of capital is the theoretical cost of capital incurred by a firm. This cost may be determined by reference to interest rates on debt or a blending of debt/equity costs.
In the alternative, management may simply adopt a minimum required threshold rate of return that must be exceeded before an investment will be undertaken. If a prospective investment has a positive net present value (i.e., the present value of cash inflows exceeds the present value of cash outflows), then it clears the minimum cost of capital and is deemed to be a suitable undertaking. On the other hand, if an investment has a negative net present value (i.e., the present value of cash inflows is less than the present value of cash outflows), the investment opportunity should be rejected.
To illustrate NPV, return to the illustration for Markum Real Estate. Assume that the firm’s cost of capital is 5%. Recall that the present value of the cash inflows is $807,828. Additionally assume that the up-front purchase price for the building is $575,000. The remodel effort will require $60,000 to be spent at the end of Year 1 and Year 2. Maintenance, insurance, and taxes on the building will amount to $10,000 per year, payable at the end of each of the five years. The present value of the cash outflows is $729,859:
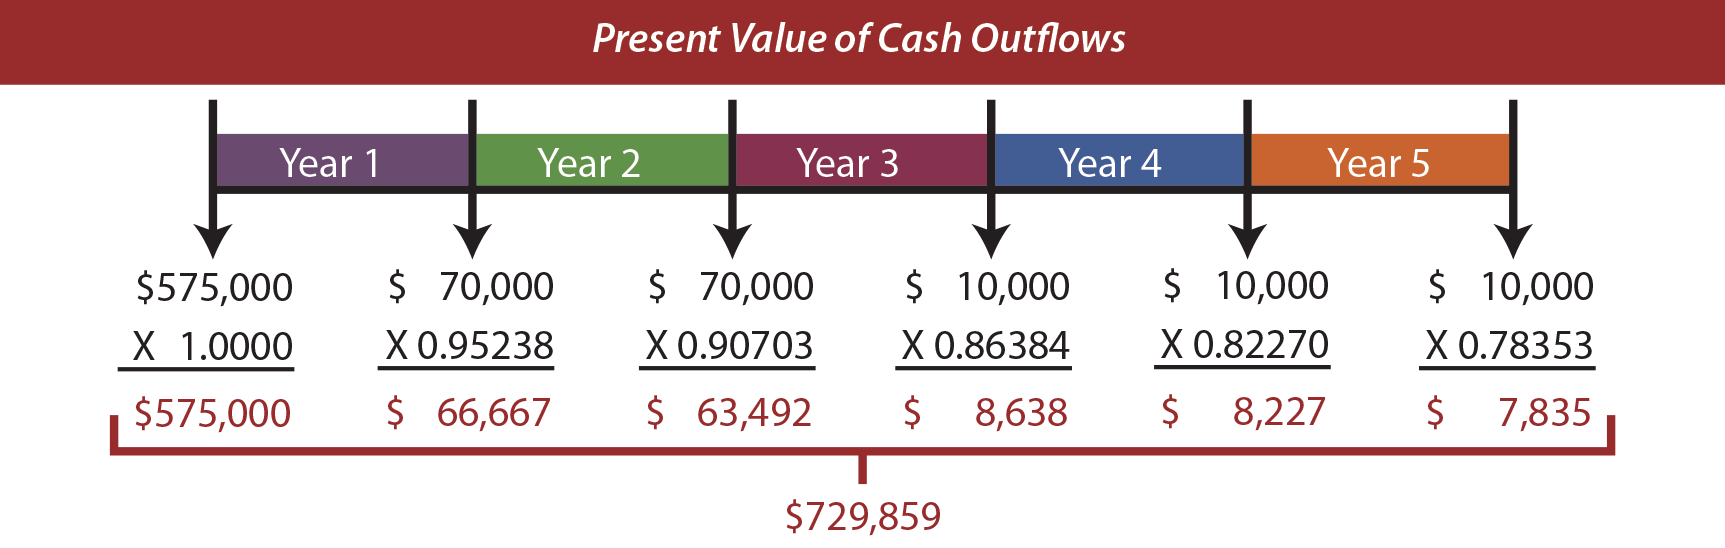
This project has a positive net present value of $77,969 ($807,828 – $729,859). This suggests that the project’s returns exceed the 5% cost of capital threshold. Had the up-front investment been $675,000 (instead of $575,000), the project would have a negative net present value of $22,031 ($807,828 – $829,859).
Changes In Rates
Carefully consider the mathematics (or table values), and observe that:
Higher interest rates produce lower present value factors, and vice versa.
 Thus, the logic of making certain investments changes with interest rates. Perhaps one has considered buying a house or car on credit. In considering the decision, the interest rates on the deal likely made a big difference in how the proposed transaction was viewed.
Even a casual observer of macroeconomic trends knows that government policies about interest rates influence investment activity and consumer behavior. In simple terms, lower rates can stimulate borrowing and investment, and vice versa.
To illustrate the impact of shifting interest rates, consider that Greenspan is considering a $500,000 investment that returns $128,000 at the end of each year for five years. The following spreadsheet shows how the net present value shifts from a positive net present value of $39,183 (when interest rates are 6%), to positive $11,067 (when interest rates are 8%), to negative $14,779 (when interest rates rise to 10%). This means that the investment would make sense if the cost of capital was 6%, but not 10%.
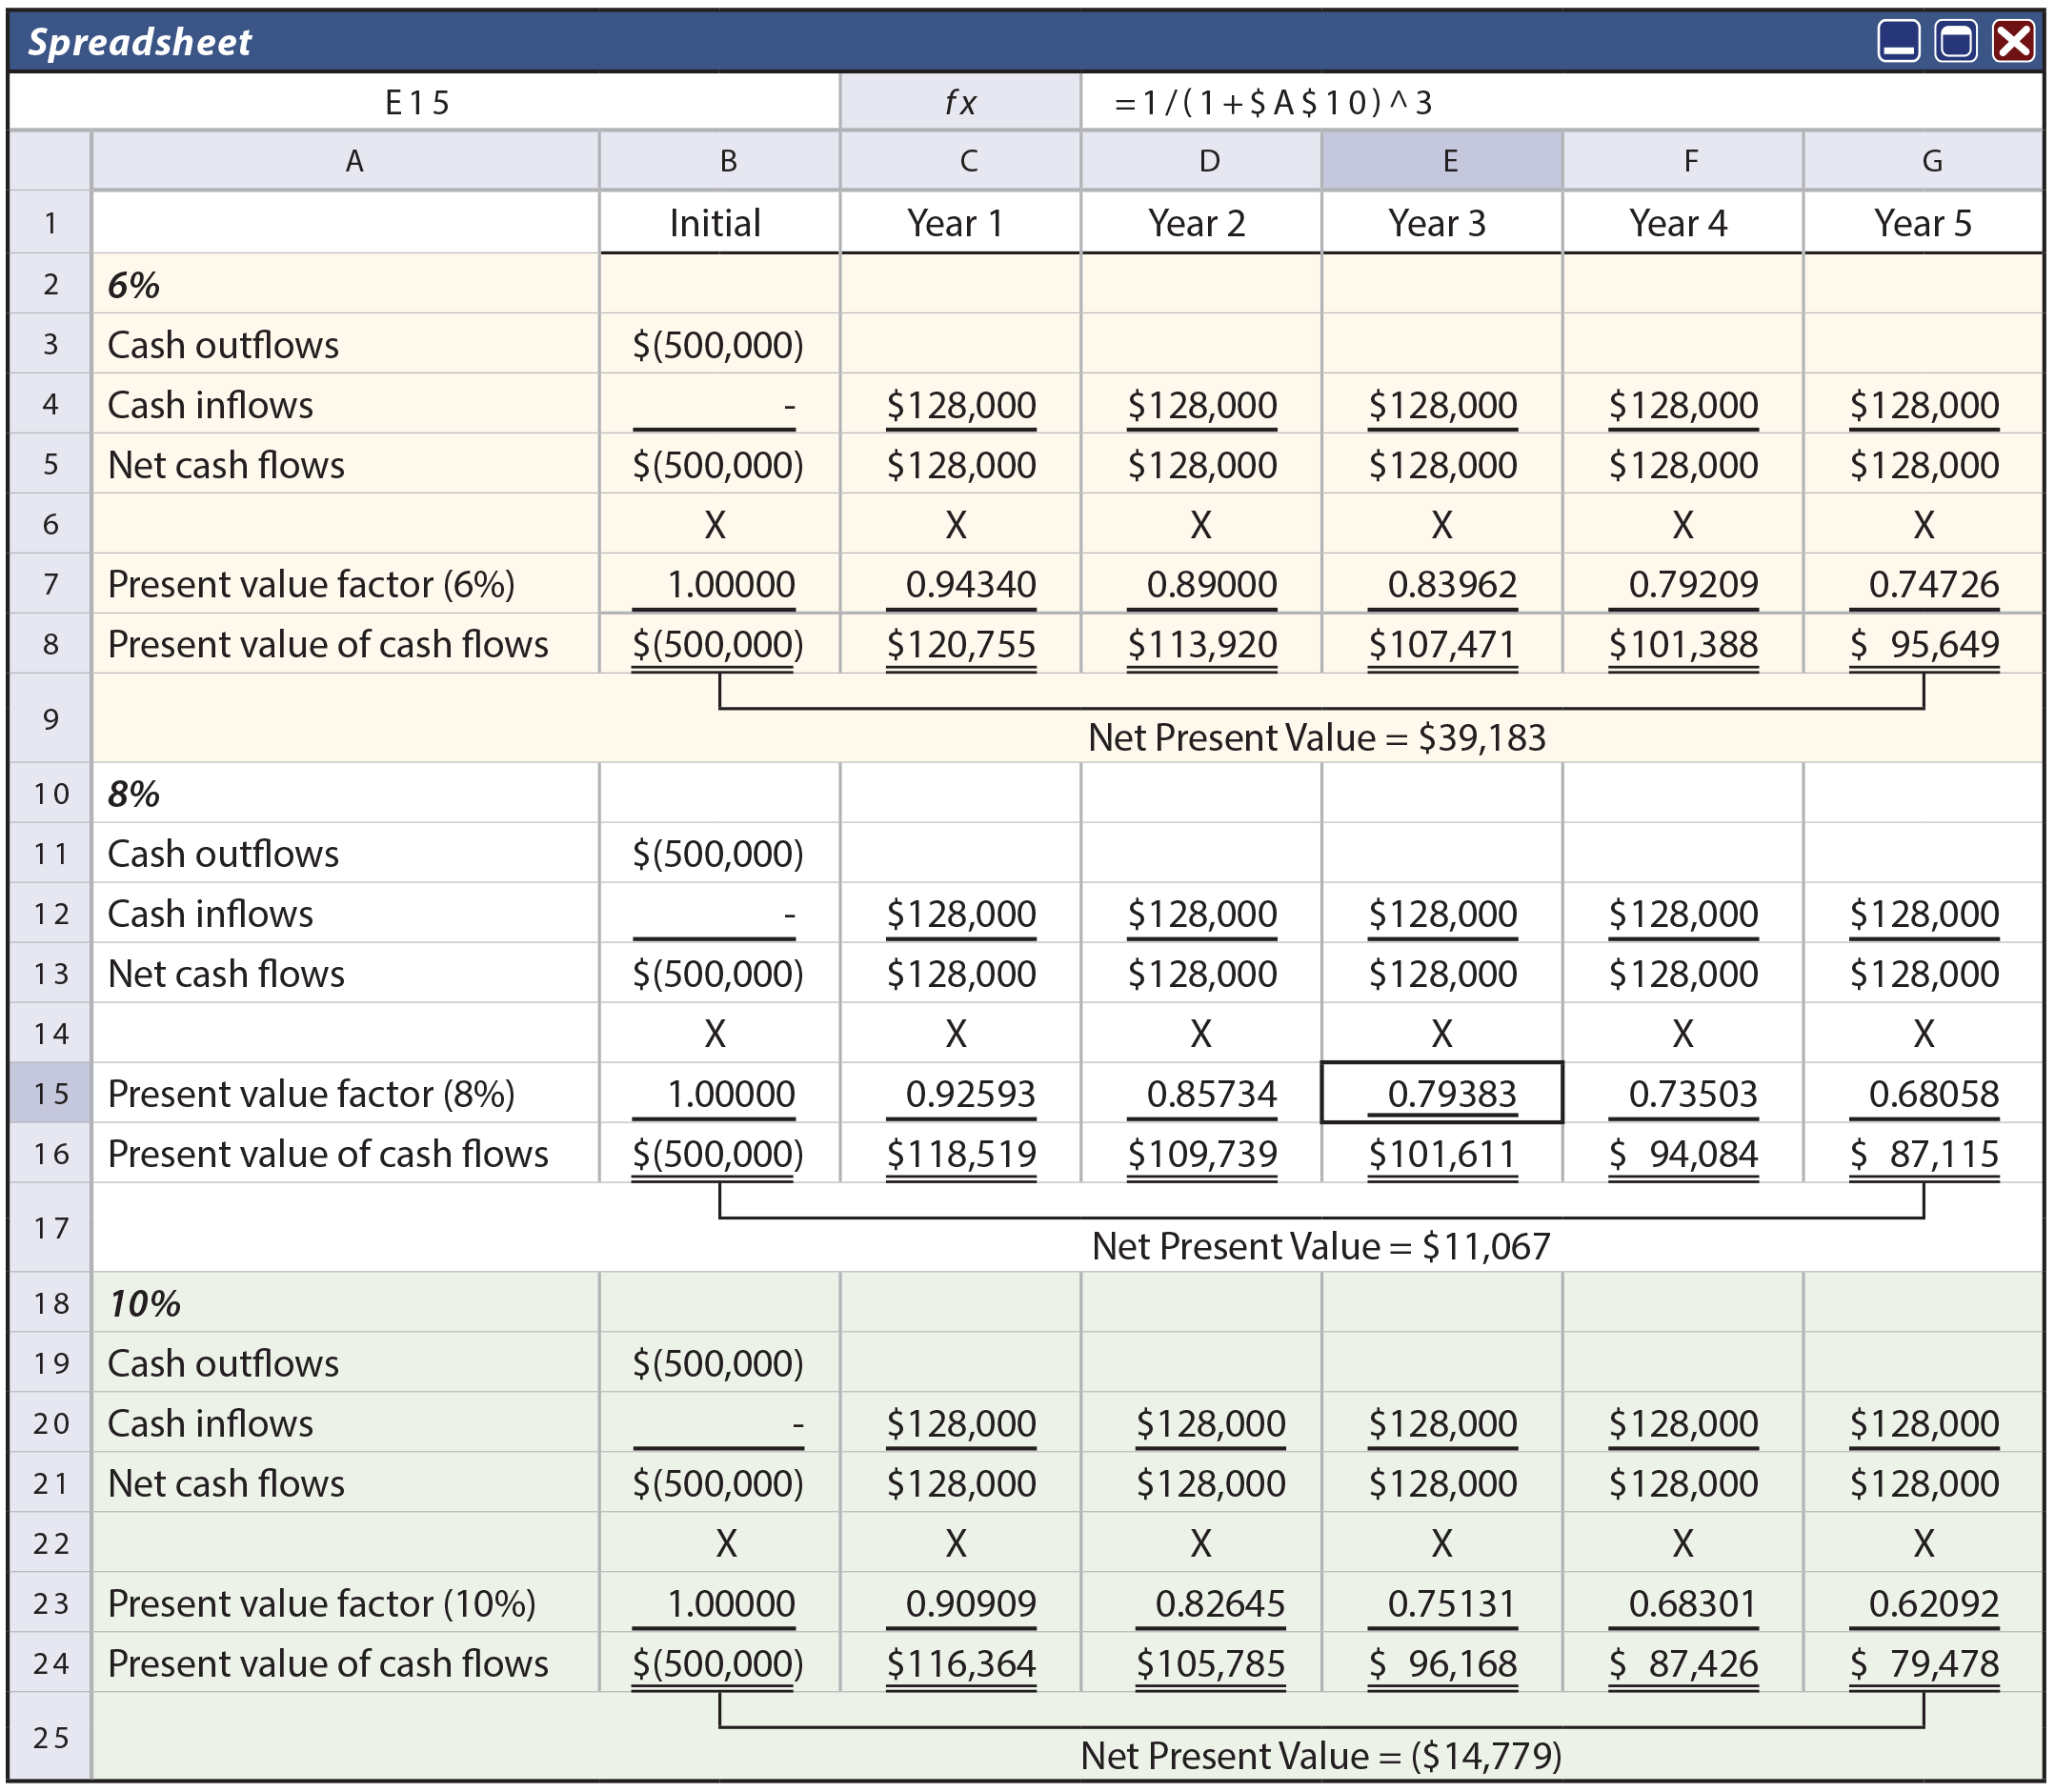
In the preceding spreadsheet, formulas were used to determine present value factors. For example, cell E15 includes the formula: 1/(1+$A$10)^3. This formula draws the interest rate from cell A10. This simple approach allows rapid recalculation of net present value by simply changing the value in the interest rate cell.
Emphasis On After-Tax Cash Flows
In computing NPV, notice that the focus is on cash flows, not “income.” Items like depreciation do not impact the cash flows and are not included in the present value calculations. That is why the illustration for Markum Real Estate did not include deductions for depreciation. However, when applying net present value considerations in practice, one must be well versed in tax effects. Some noncash expenses like depreciation can reduce taxable income, which in turn reduces the amount of cash that must be paid for taxes. Therefore, cash inflows and outflows associated with a particular investment should be carefully analyzed on an after-tax basis. This often entails the preparation of pro forma cash flow statements and consultation with professionals well versed in the details of specific tax rules.
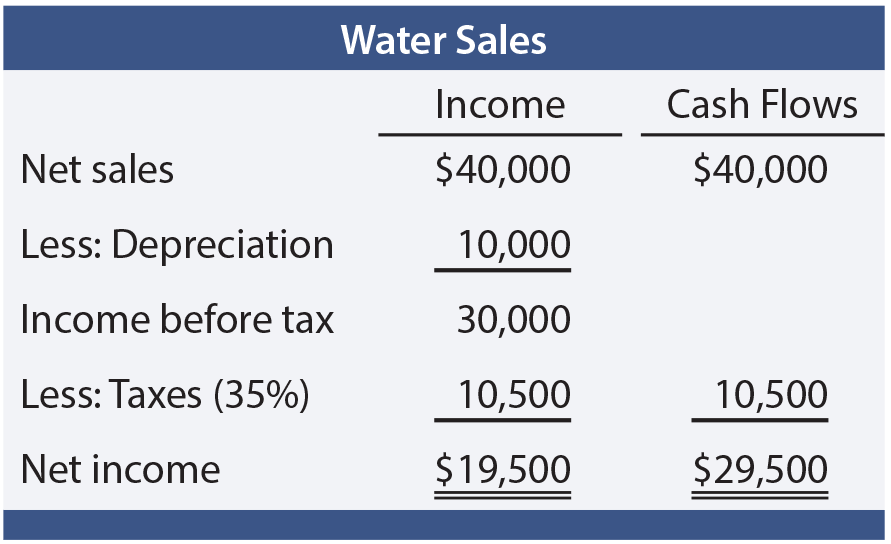 As a simple illustration, assume that Mirage Company purchases a tract of land with a prolific spring-fed creek. The land cost is $100,000, and $50,000 is spent to construct a water bottling facility. Net water sales amount to $40,000 per year (for simplicity, assume this amount is collected at the end of each year and is net of all cash expenses). The bottling plant has a 5-year life and is depreciated by the straight-line method. Recall that land is not depreciated. At the end of five years, it is anticipated that the land will be sold for $100,000. Mirage has an 8% cost of capital, and is subject to a 35% tax rate on profits. The table shows the calculation of annual income and cash flows.
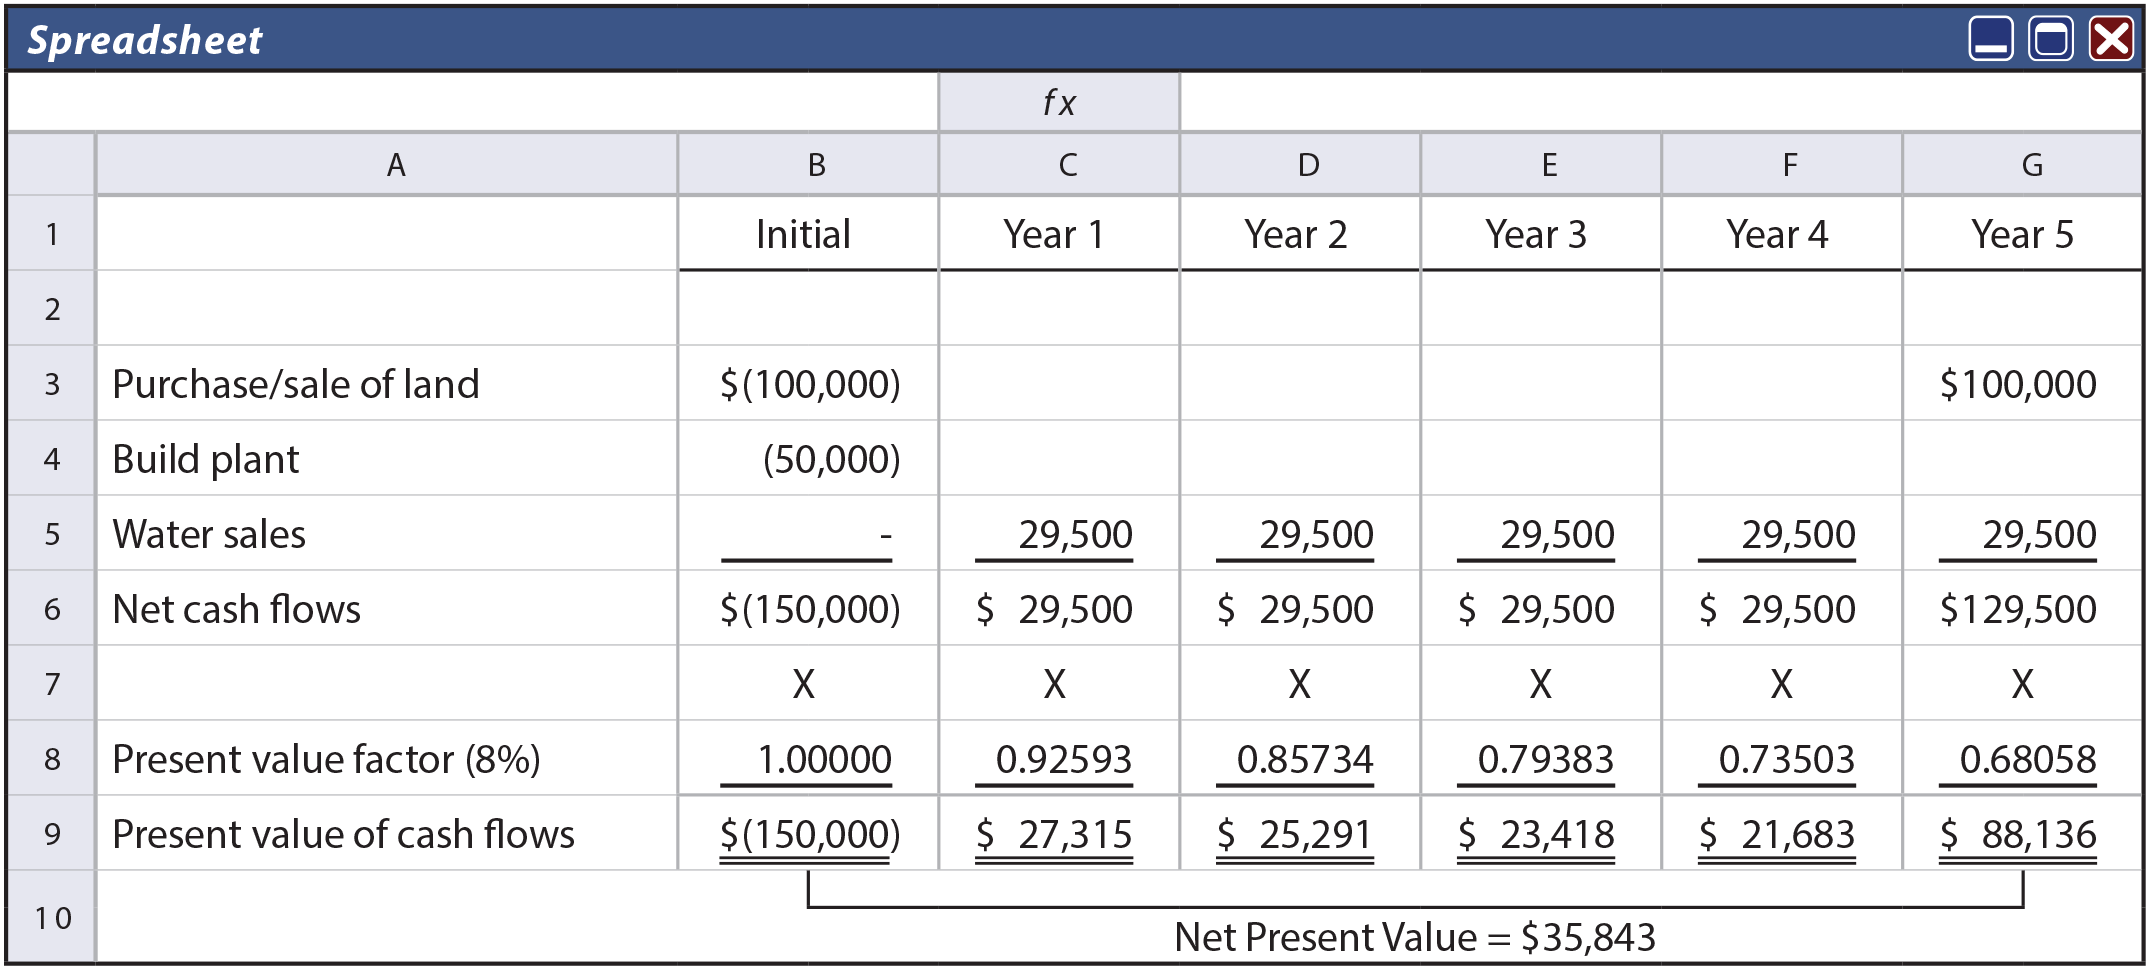
The annual cash flow from water sales (not the net income) is incorporated into the following spreadsheet. The annual net cash flows are then multiplied by the appropriate present value factors corresponding to an 8% discount rate. The project has a positive net present value of $35,843. Interestingly, had the annual net income of $19,500 been erroneously substituted for the $29,500 annual cash flow, this analysis would have produced a negative net present value. One cannot underestimate the importance of considering tax effects on the viability of investment alternatives.
Accounting Rate Of Return
The accounting rate of return is an alternative evaluative tool that focuses on accounting income rather than cash flows. This method divides the average annual increase in income by the amount of initial investment. For Mirage’s project, the accounting rate of return is 13% ($19,500/$150,000). The accounting rate of return is simple and easy. The decision rule is to accept investments that exceed a particular accounting rate of return. But, the method ignores the time value of money, the duration of cash flows, and terminal returns of invested dollars (e.g., notice that Mirage plans to get the $100,000 back at the end of the project). As a result, by itself, the accounting rate of return can easily misidentify the best investment alternatives. It should be used with extreme care.
Internal Rate Of Return
The internal rate of return (also called the time-adjusted rate of return) is similar to NPV. But, rather than working with a predetermined cost of capital, this method calculates the actual discount rate that equates the present value of a project’s cash inflows with the present value of the cash outflows. In other words, it is the interest rate that would cause the net present value to be zero.
IRR is a ranking tool, calculated for each investment opportunity. The decision rule is to accept the projects with the highest internal rates of return, so long as those rates are at least equal to the firm’s cost of capital. This contrasts with NPV, which has a general decision rule of accepting projects with a “positive NPV,” subject to availability of capital. Fundamentally, the mathematical basis of IRR is not much different than NPV.
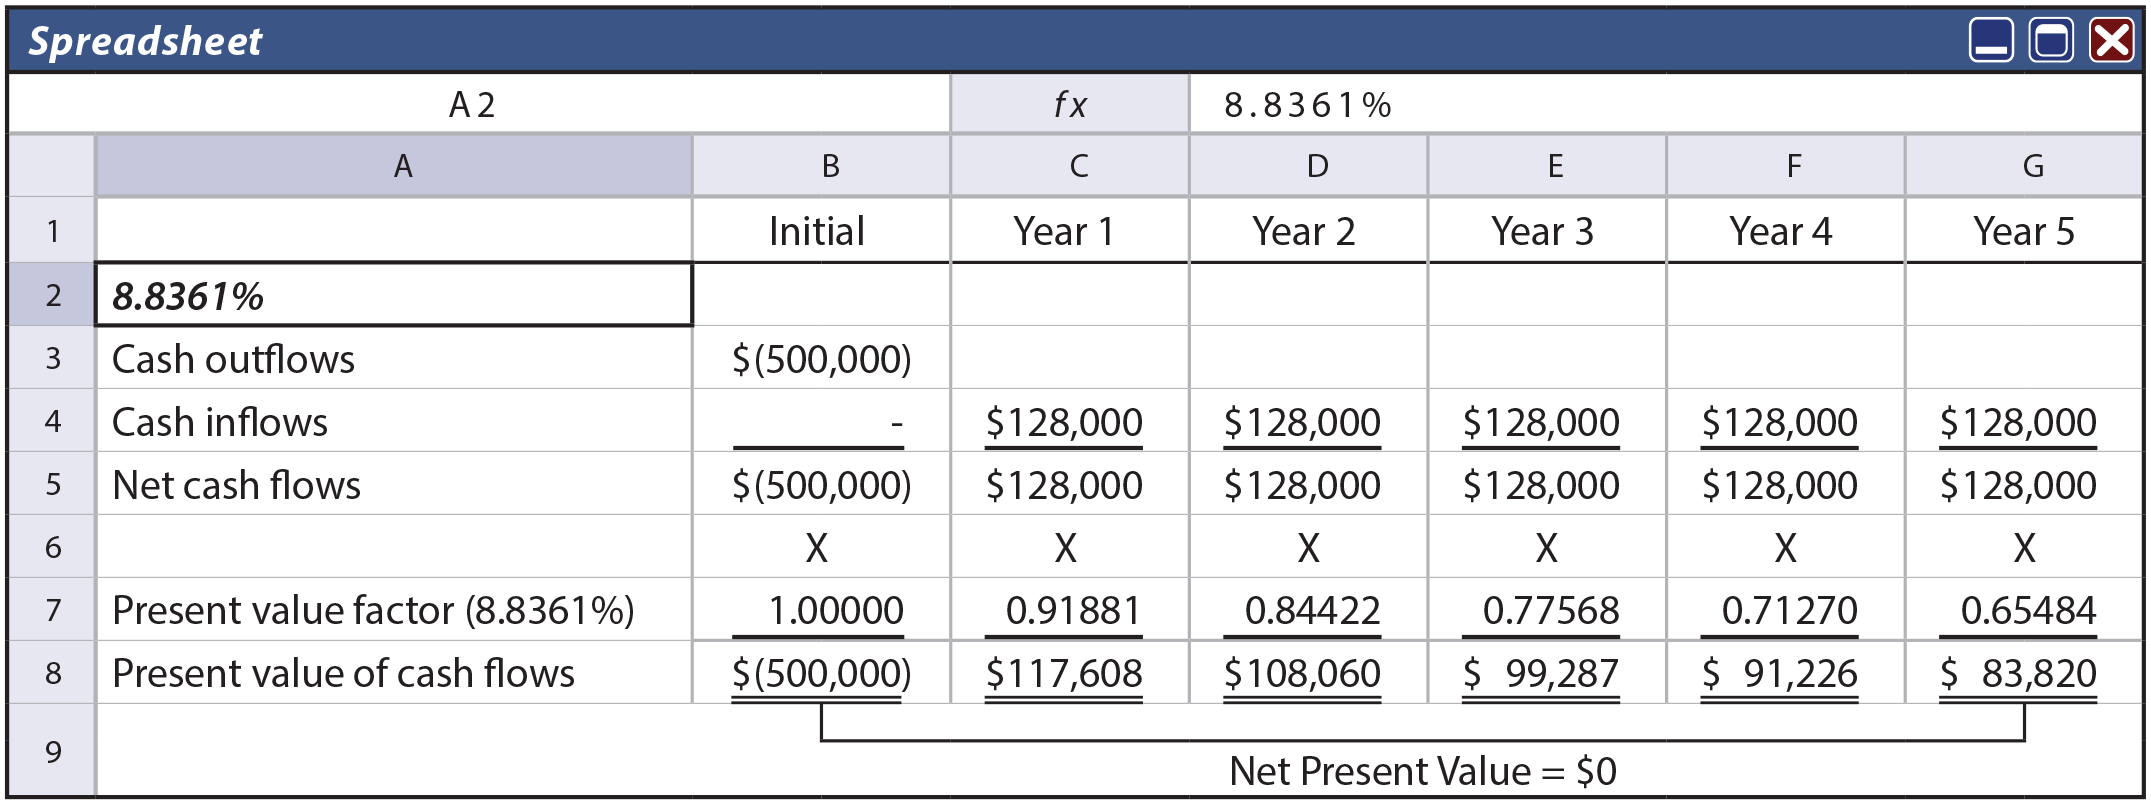
The manual calculation of IRR using present value tables is challenging. One would repeatedly try rates until the rate that caused the present value of cash inflows to equal the present value of cash outflows is isolated. If the available tables are not sufficiently detailed, some interpolation would be needed. However, spreadsheet routines are much easier. Reconsider the illustration for Greenspan. The following spreadsheet uses an interest rate of 8.8361%. Notice that this rate caused the net present value to be zero and is the IRR. This rate was selected by a higher-lower guessing process (trying each interest rate guess in cell A2). This does not take as many guesses as one might think; with a little logic, the exact correct rate can be found rather quickly.
Payback Method
 The payback method is a popular and easy method, and can be valuable when the key investment goal is to find projects where the initial investment is quickly recovered. But, it is not very strong in otherwise pinpointing the best capital investment decisions.
Payback is calculated by dividing the initial investment by the annual cash inflow. The earlier illustration for Greenspan has a payback of approximately 3.9 years ($500,000/$128,000 = 3.9). If an investment involves uneven cash flows, the computation requires scheduling cash inflows and outflows. The payback period is the point at which the cumulative net cash inflows begin to exceed the cumulative net cash outflows.
The method is deficient in that it does not take into account the time value of money. It also fails to reveal what happens after the payback period. For example, some investments may pay back rapidly, but have little residual cash flow after the payback period. Other investments may take years to pay back and then continue to generate future returns for many more years to come. Although the investment with the shorter payback may be viewed as favorable, it could easily turn out to be the worst choice. All in all, be very cautious using the payback method for making business decisions.
Conclusion
Capital budgeting decisions are not much different than the whole of managerial accounting. There are many tools one should understand and utilize. But, in the final analysis, good decision making will be driven by reasoned judgment.
| Did you learn? |
|---|
| Be able to calculate the net present value of an investment, and explain the method’s strengths and weaknesses. |
| How does depreciation impact cash flow calculations? |
| Explain and perform cash-flow calculations on a net-of-tax basis. |
| Be able to calculate the accounting rate of return for an investment, and explain the method’s strengths and weaknesses. |
| Be able to calculate the internal rate of return for an investment, and explain the method’s strengths and weaknesses. |
| Be able to calculate the payback period for an investment, and explain the method’s strengths and weaknesses. |