 How is one to meaningfully compare the net income of a large corporation that has millions of shares outstanding to smaller companies that may have less than even one million shares? The larger company is probably expected to produce a greater amount of income. But, the smaller company might be doing better per unit of ownership. To adjust for differences in size, public companies must supplement their income reports with a number that represents earnings on a per common share basis.
Earnings per share, or EPS, is a widely followed performance measure. Corporate communications and news stories will typically focus on EPS, but care should be taken in drawing any definitive conclusions. Nonrecurring transactions and events can positively or negatively impact income. Companies that present an income statement that segregates income from continuing operations from other components of income must also subdivide per share data (e.g., EPS from continuing operations, discontinued operations, etc.).
Basic EPS
Basic EPS may be thought of as a fraction with income in the numerator and the number of common shares in the denominator. Expanding this thought, consider that income is for a period of time (e.g., a quarter or year), and during that period of time, the number of shares might have changed because of share issuances or treasury stock transactions. Therefore, a more correct characterization is income divided by the weighted-average number of common shares outstanding.
Further, consider that some companies have both common and preferred shares. Dividends on common and preferred stock are not expenses and do not reduce income. However, preferred dividends do lay claim to a portion of the corporate income stream. Therefore, one more modification is needed to correctly portray the basic EPS fraction:
Basic EPS = Income Available to Common / Weighted-Average Number of Common Shares Outstanding
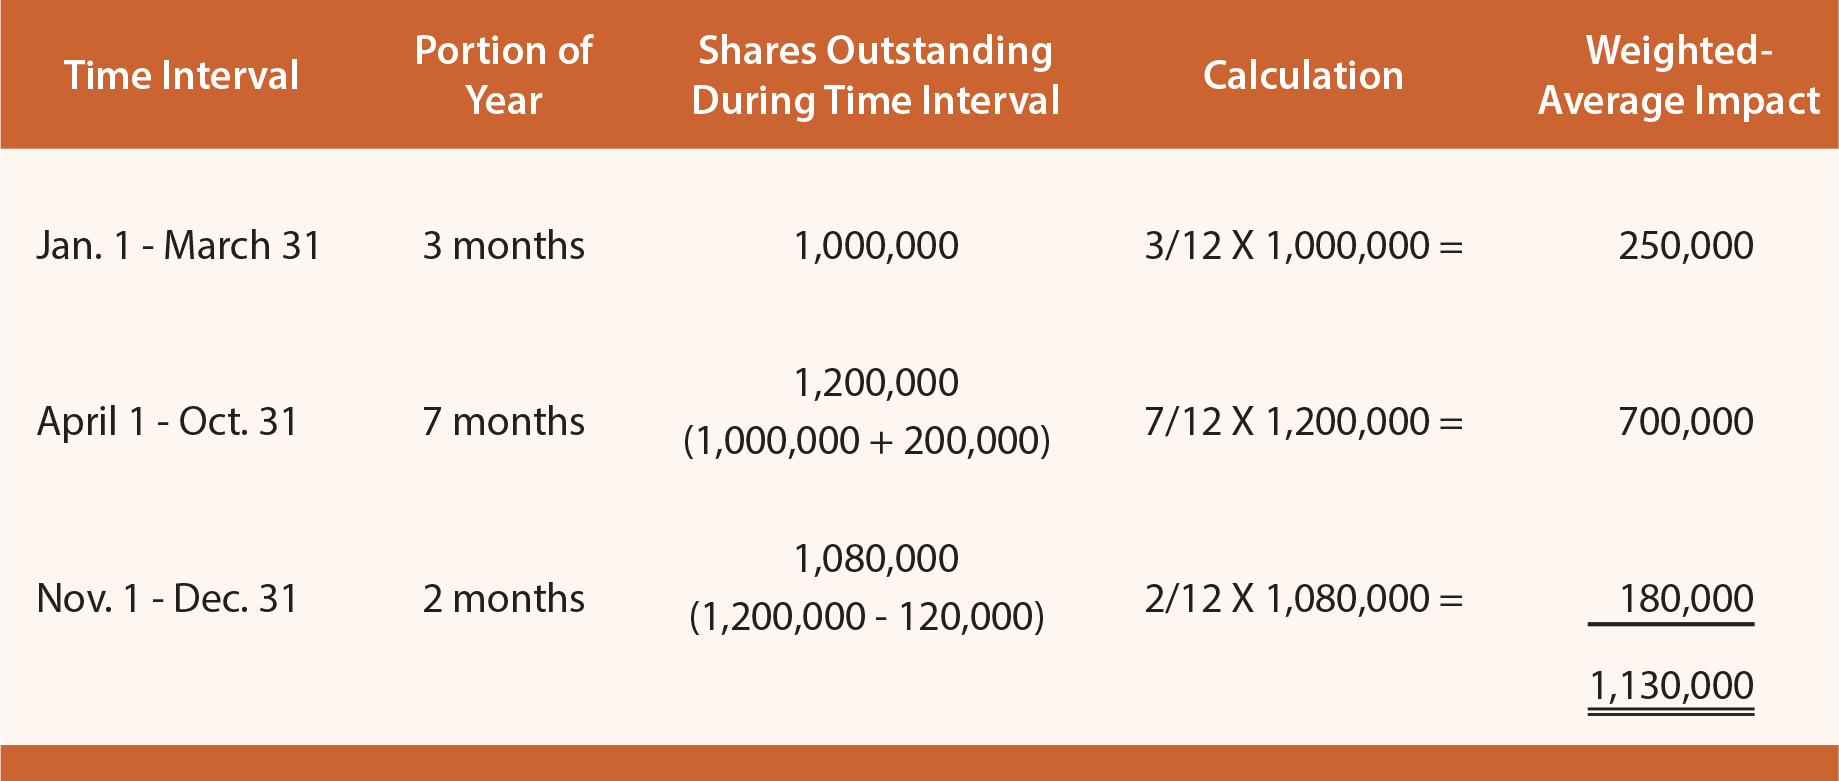
The basic EPS calculation entails a reduction of income by the amount of preferred dividends for the period. To illustrate, assume that Kooyul Corporation began 20X4 with 1,000,000 shares of common stock outstanding. On April 1, 20X4, Kooyul issued 200,000 additional shares of common stock, and 120,000 shares of common stock were reacquired on November 1. Kooyul reported net income of $2,760,000 for the year ending December 31, 20X4. Kooyul also had 50,000 shares of preferred stock on which $500,000 in dividends were rightfully declared and paid during 20X4. Kooyul paid $270,000 in dividends to common shareholders. Therefore, Kooyul’s basic EPS is $2 per share ($2,260,000/1,130,000), as discussed in the following paragraph.
Income available to Kooyul’s common shareholders is $2,260,000. This amount is calculated as the net income ($2,760,000) minus the preferred dividends ($500,000). Dividends on common stock do not impact the EPS calculation. Weighted-average common shares outstanding during 20X4 are 1,130,000. The following table illustrates this calculation:
Diluted EPS
Some companies must report an additional diluted EPS number. The diluted EPS is applicable to companies that have complex capital structures. Examples include companies that have issued stock options and warrants that entitle their holders to buy additional shares of common stock from the company, and convertible bonds and preferred stocks that are exchangeable for common shares. These financial instruments represent the possibility that more shares of common stock will be issued and are potentially “dilutive” to existing common shareholders.
Companies with dilutive securities take the potential effect of dilution into consideration in calculating diluted EPS. These calculations require a series of assumptions about dilutive securities being converted into common stock.
The hypothetical calculations are imaginative; even providing guidelines about how assumed money generated from assumed exercises of options and warrants is assumed to be “reinvested.” Diluted EPS provides existing shareholders a measure of how the company’s income is potentially to be shared with other interests.
Price/Earnings Ratio
Financial analysts often incorporate reported EPS information into the calculation of the price/earnings ratio (P/E). This is simply the stock price per share divided by the annual EPS:
Price Earnings Ratio = Market Price Per Share / Earnings Per Share
For example, a stock selling at $15 per share with $1 of EPS would have a P/E of 15. Other companies may have a P/E of 5 or 25. Wouldn’t investors always be drawn to companies that have the lowest ratios since they may represent the best earnings generation per dollar of required investment? Perhaps not, as the “E” in P/E is past earnings. New companies may have a bright future, even if current earnings are not great. Other companies may have great current earnings, but no room to grow.
Another ratio is the “PEG” ratio that relates P/E to the earnings “growth” rate, with growth expressed as a whole number. For example, a company with a P/E of 20 that is experiencing average annual increases in income of 20% would have a PEG of 1 (20 divided by 20). If the same company instead had annual earnings increases of 10%, then the PEG would be 2 (20 divided by 10). Lower PEG numbers sometimes help identify more attractive investments.
Book Value Per Share
Another per share amount that analysts frequently calculate is the book value per share. This refers to the amount of reported stockholders’ equity for each share of common stock. Book value is not the same thing as market value or fair value. Book value is based on reported amounts within the balance sheet.
Many items included in the balance sheet are based on historical costs which can be well below fair value. On the other hand, do not automatically conclude that a company is worth more than its book value, as some balance sheets include significant intangibles that cannot be easily converted to value.
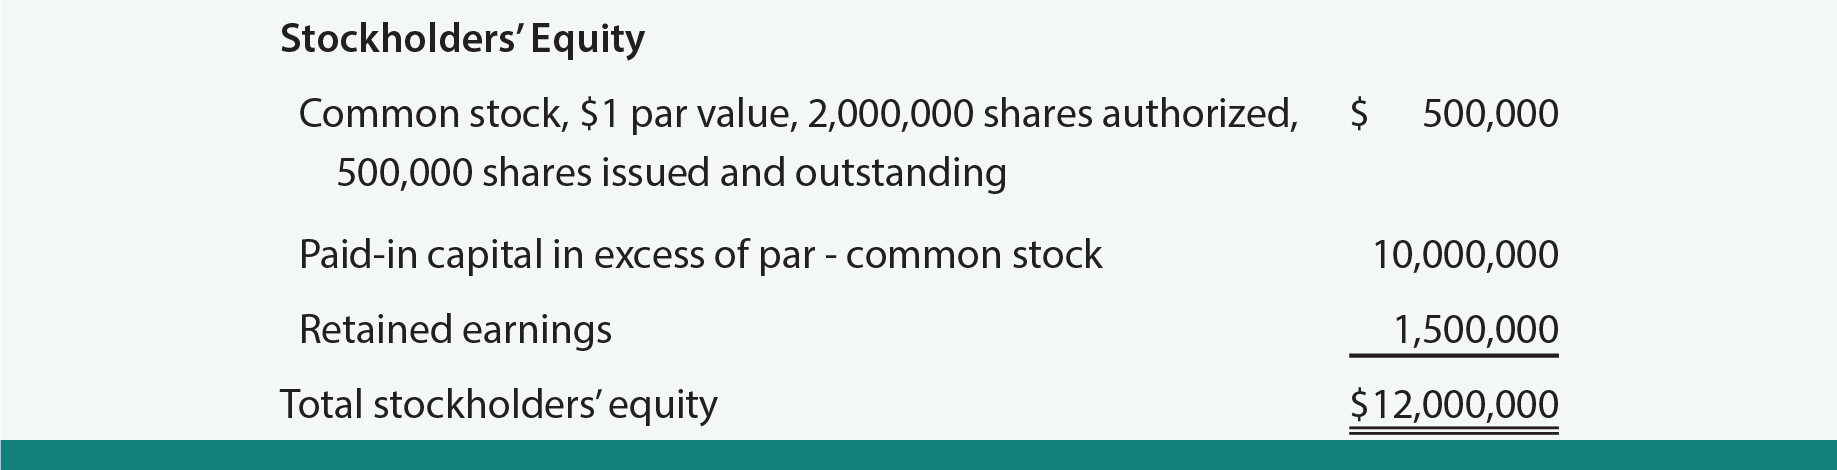
For a corporation the has only common stock outstanding, the calculation of book value per share is simple. Total stockholders’ equity is divided by common shares outstanding at the end of the accounting period.
To illustrate, assume that Fuller Corporation has the following stockholders’ equity, which results in a $24 book value per share ($12,000,000/500,000 shares):
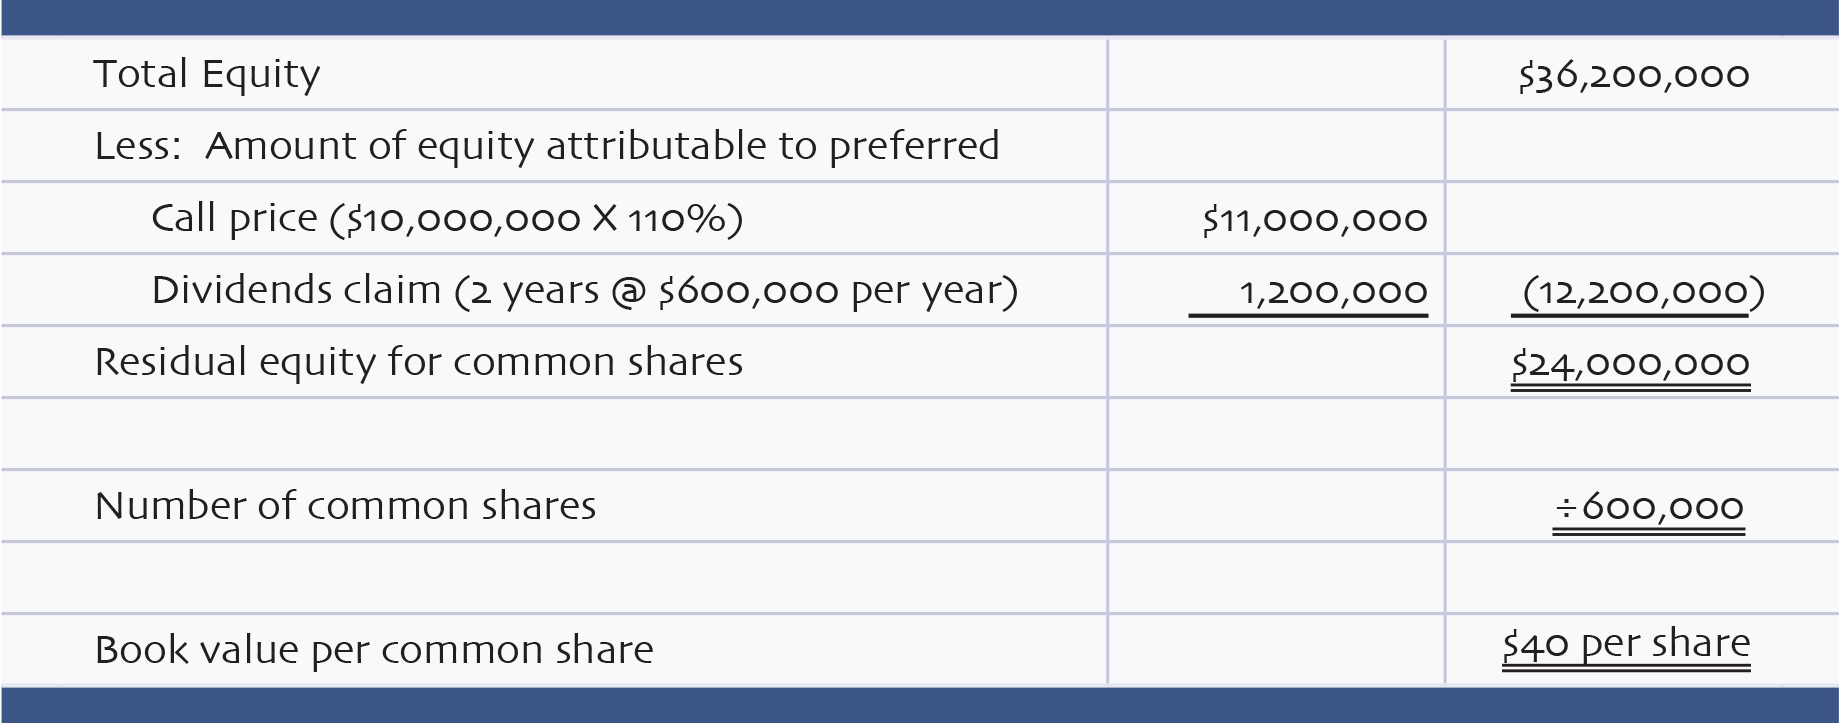
A company with preferred stock must allocate total equity between the common and preferred shares. The amount of equity attributable to preferred shares is generally considered to be the call price (i.e., redemption or liquidation price) plus any dividends that are due. The remaining amount of “common” equity (total equity minus equity attributable to preferred stock) is divided by the number of common shares to calculate book value per common share:
Book Value Per Share = “Common” Equity / Common Shares Outstanding
Assume that Muller Corporation has the following stockholders’ equity:

Mike Kreinhop is a financial analyst for an investment fund, and is evaluating the merits of Muller Corporation. Pursuant to this task, he has diligently combed through the notes to the financial statements and found that the preferred dividends were not paid in the current or prior year. He notes that the annual dividend is $600,000 (6% X $10,000,000) and the preferred stock is cumulative in nature. Although Muller has sufficient retained earnings to support a dividend, it is presently cash constrained due to reinvestment of all free cash flow in a new building and expansion of inventory. Kreinhop correctly prepared the following book value per share calculation:
Dividend Rates And Payout Ratios
Many companies do not pay dividends. One explanation is that the company is not making any money. Hopefully, the better explanation is that the company needs the cash it is generating from operations to reinvest in expanding a successful concept. On the other hand, some profitable and mature businesses can easily manage their growth and still have plenty of cash left to pay a reasonable dividend to shareholders. In evaluating the dividends of a company, analysts calculate the dividend rate (also known as yield).
The dividend rate is the annual dividend divided by the stock price:
Dividend Rate = Annual Cash Dividend / Market Price Per Share
If Pustejovsky Company pays dividends of $1 per share each year, and its stock is selling at $20 per share, it is yielding 5% ($1/$20). Analysts may be interested in evaluating whether a company is capable of sustaining its dividends and will compare the dividends to the earnings:
Dividend Payout Ratio = Annual Cash Dividend / Earnings Per Share
If Pustejovsky earned $3 per share, its payout ratio is .333 ($1/$3). On the other hand, if the earnings were only $0.50, giving rise to a dividend payout ratio of 2 ($1/$0.50), one would begin to question the “safety” of the dividend.
Rates Of Return
Some financial statement analysts will compare income to assets, in an attempt to assess how effectively assets are being utilized to generate profits. The specific income measure that is used in the return on assets ratio varies with the analyst, but one calculation is:
Return on Assets Ratio = (Net Income + Interest Expense) / Average Assets
These calculations of “ROA” attempt to focus on income (excluding financing costs) in relation to assets. The point is to demonstrate how much operating income is generated by the deployed assets of the business. This can prove useful in comparing profitability and efficiency for companies in similar industries.
The return on equity ratio evaluates income for the common shareholder in relation to the amount of invested common shareholder equity:
Return on Equity Ratio = (Net Income – Preferred Dividends) / Average Common Equity
“ROE” enables comparison of the effectiveness of capital utilization among firms. What it does not do is evaluate risk. Sometimes, firms with the best ROE also took the greatest gambles. For example, a high ROE firm may rely heavily on debt to finance the business, thereby exposing the business to greater risk of failure when things don’t work out. Analysts may compare ROE to the rate of interest on borrowed funds. This can help them assess how effective the firm is in utilizing borrowed funds (“leverage”).
| Did you learn? |
|---|
| Be able to calculate basic earnings per share. |
| Understand the concepts and computations for weighted-average shares and earnings available to common stockholders. |
| Be familiar with diluted earnings per share. |
| Understand the price/earnings ratio. |
| What is book value per share, how should it be interpreted, and how is it calculated? |
| Understand the confounding effects on book value calculations, when there is more than one class of stock. |
| Be able to calculate the dividend payout ratio and the dividend yield. |
| Be able to calculate return on assets and return on equity. |