 Anyone wishing to study this textbook can learn valuable insights about accounting. Does the mere fact that this book exists mean that everyone knows about accounting principles? Obviously not. By analogy, the same can be said about financial information. Many companies spend substantial amounts of money preparing and presenting financial statements that are readily available (the reports for U.S. public companies can be found at www.sec.gov). Does this mean that everyone has in-depth knowledge about these companies? Again, no. Some degree of study is required to benefit from the information.
It is important to know that CPAs and the SEC provide safeguards to protect the integrity of reported information, but this is entirely different than suggesting that reporting companies are necessarily good investments. For example, a company could report that its revenue stream is in decline, expenses are on the rise, and significant debt is coming due without a viable plan for making the payments. The financial statements may fully report this predicament. But, if financial statement users choose to ignore that report, only they are to blame.
Investors must be very thorough in examining the financial statements of companies in which they are considering making an investment. Sometimes, the evaluation of complex situations can be assisted by utilization of key metrics or ratios. For example, a doctor will consider a patient’s health by taking measurements of blood pressure, heart rate, cholesterol level, and so forth. Likewise, consideration of a company’s health can be measured with certain important ratios.
Detailed Example
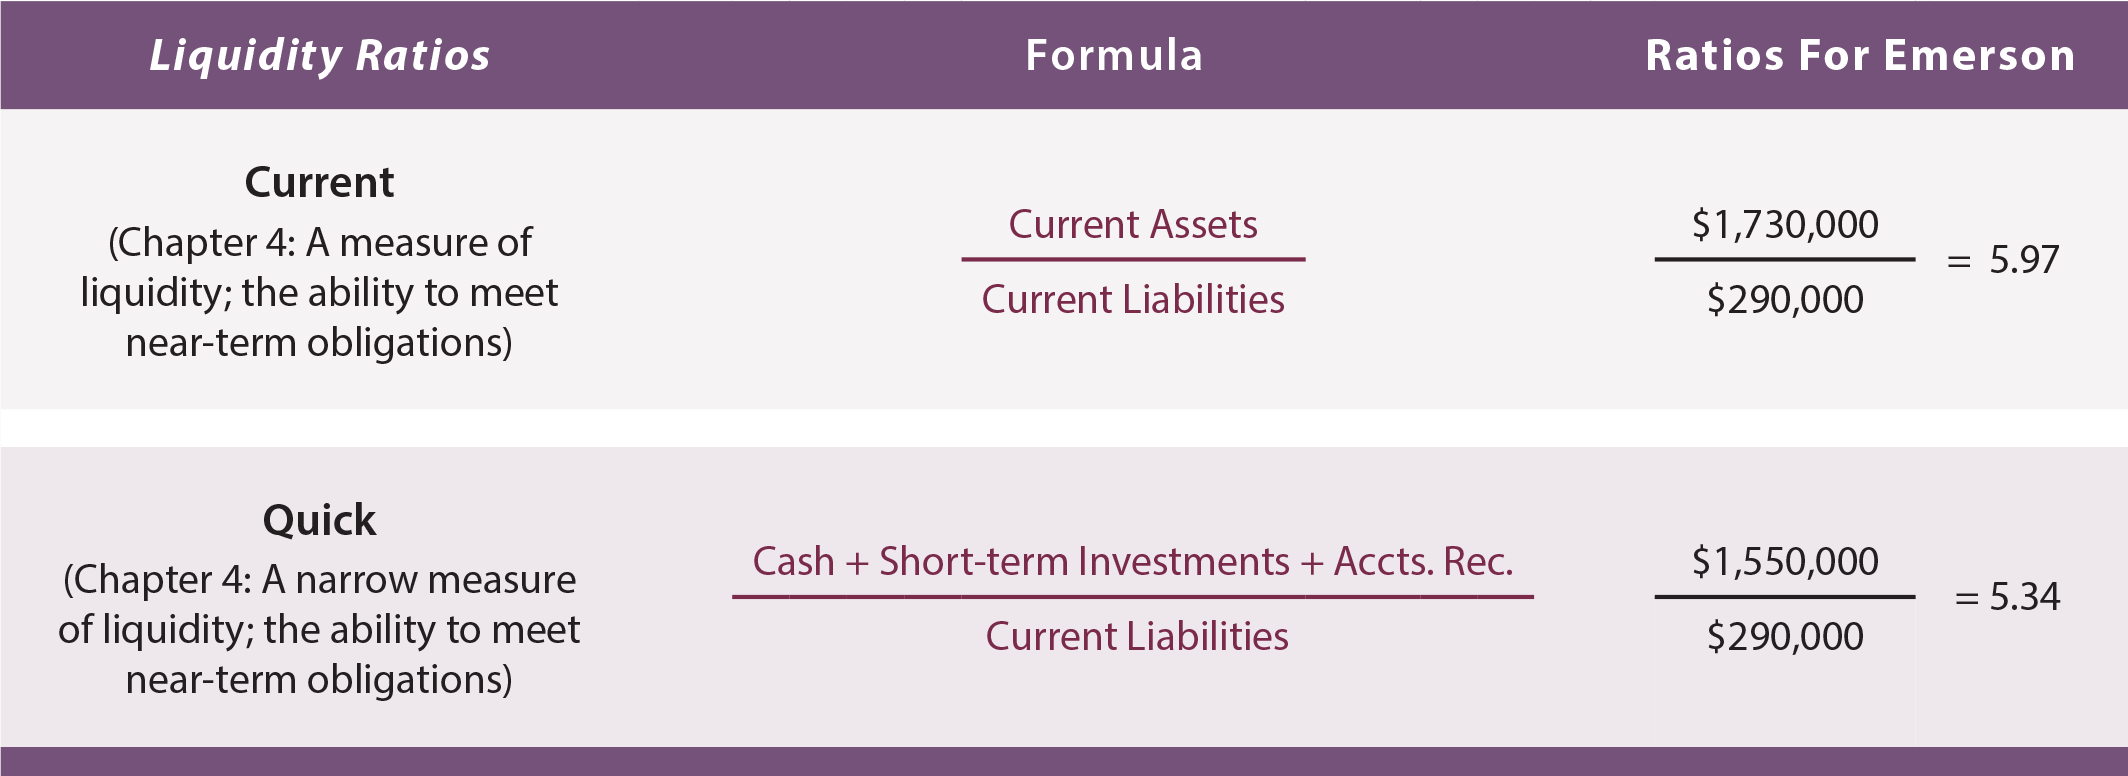
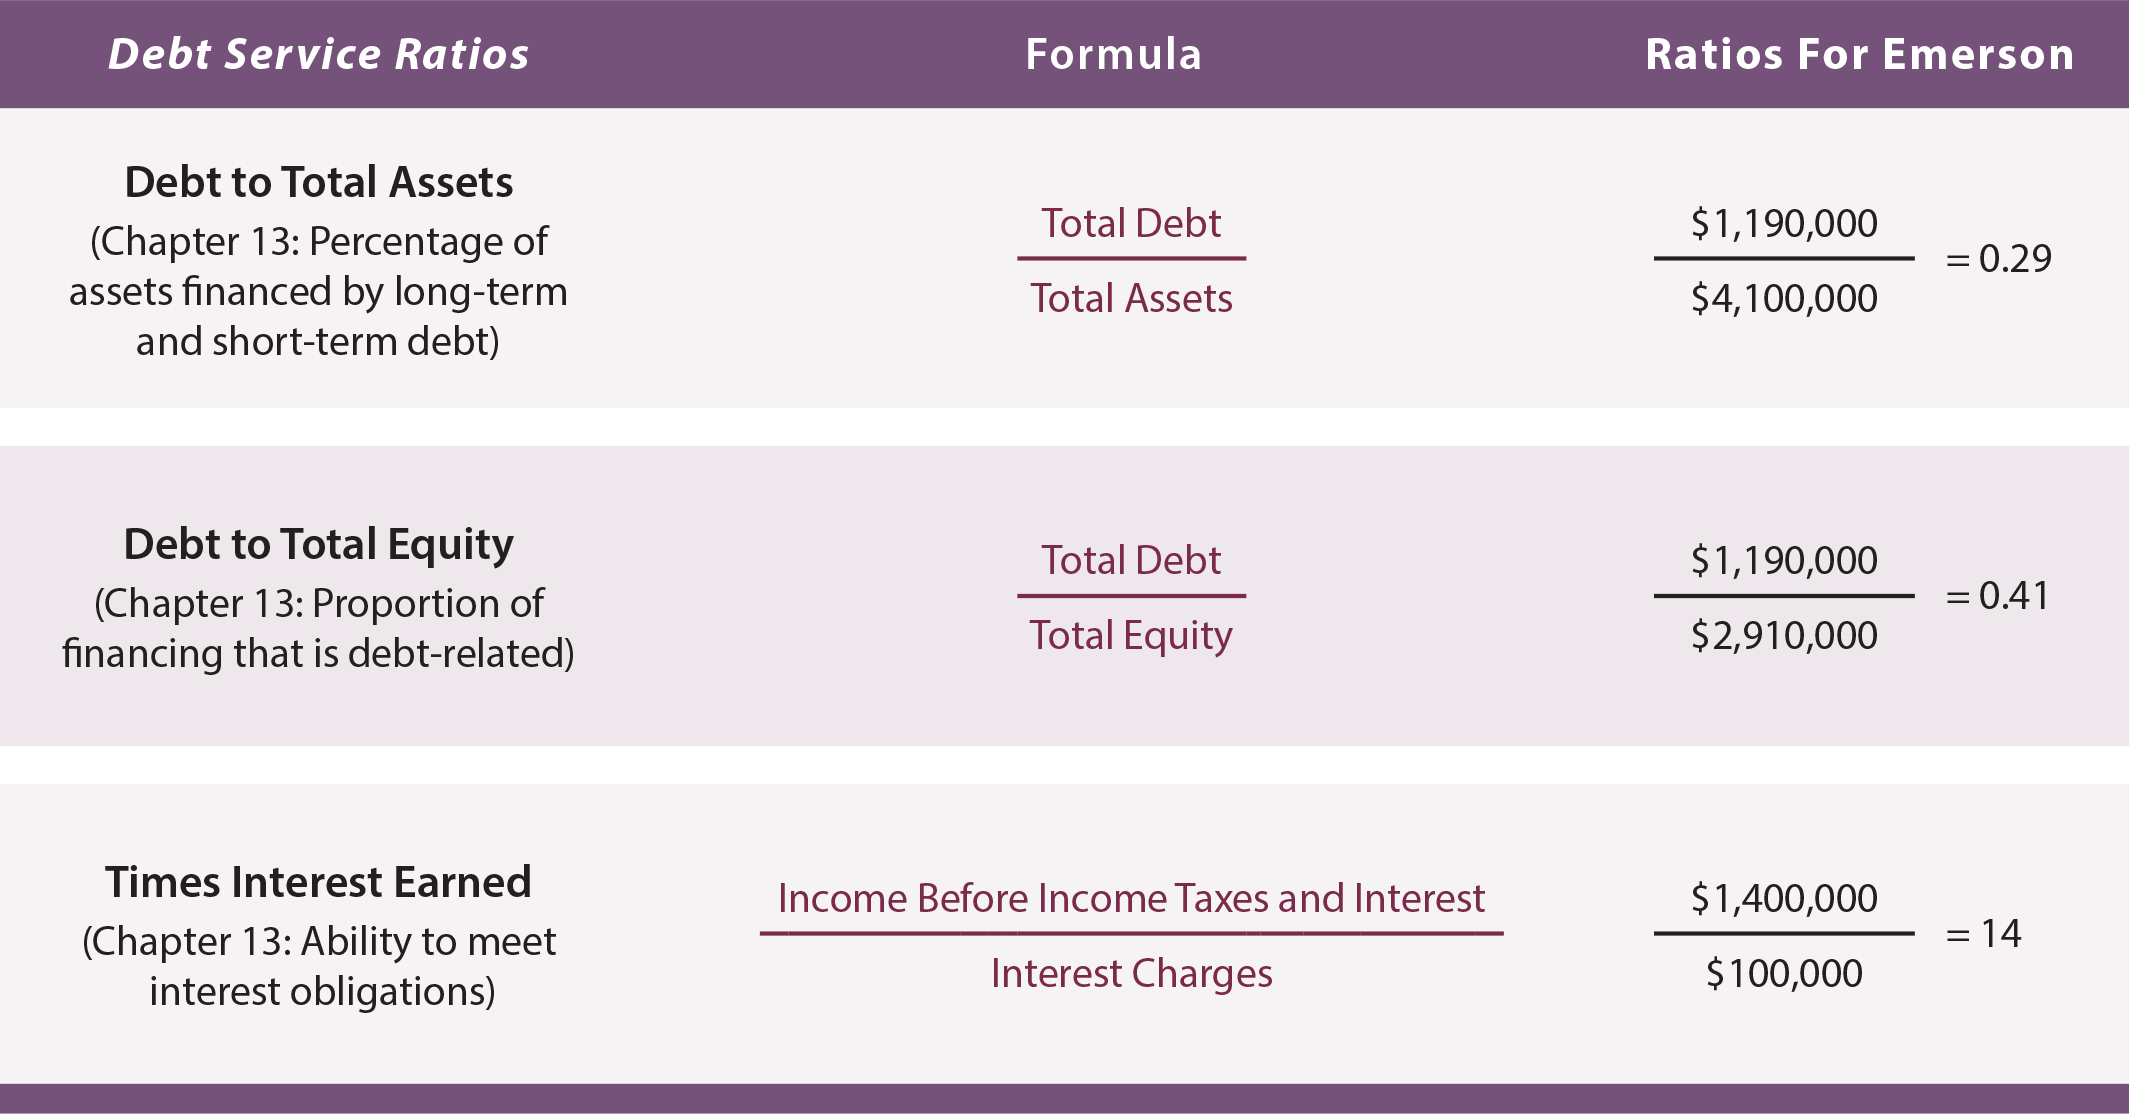
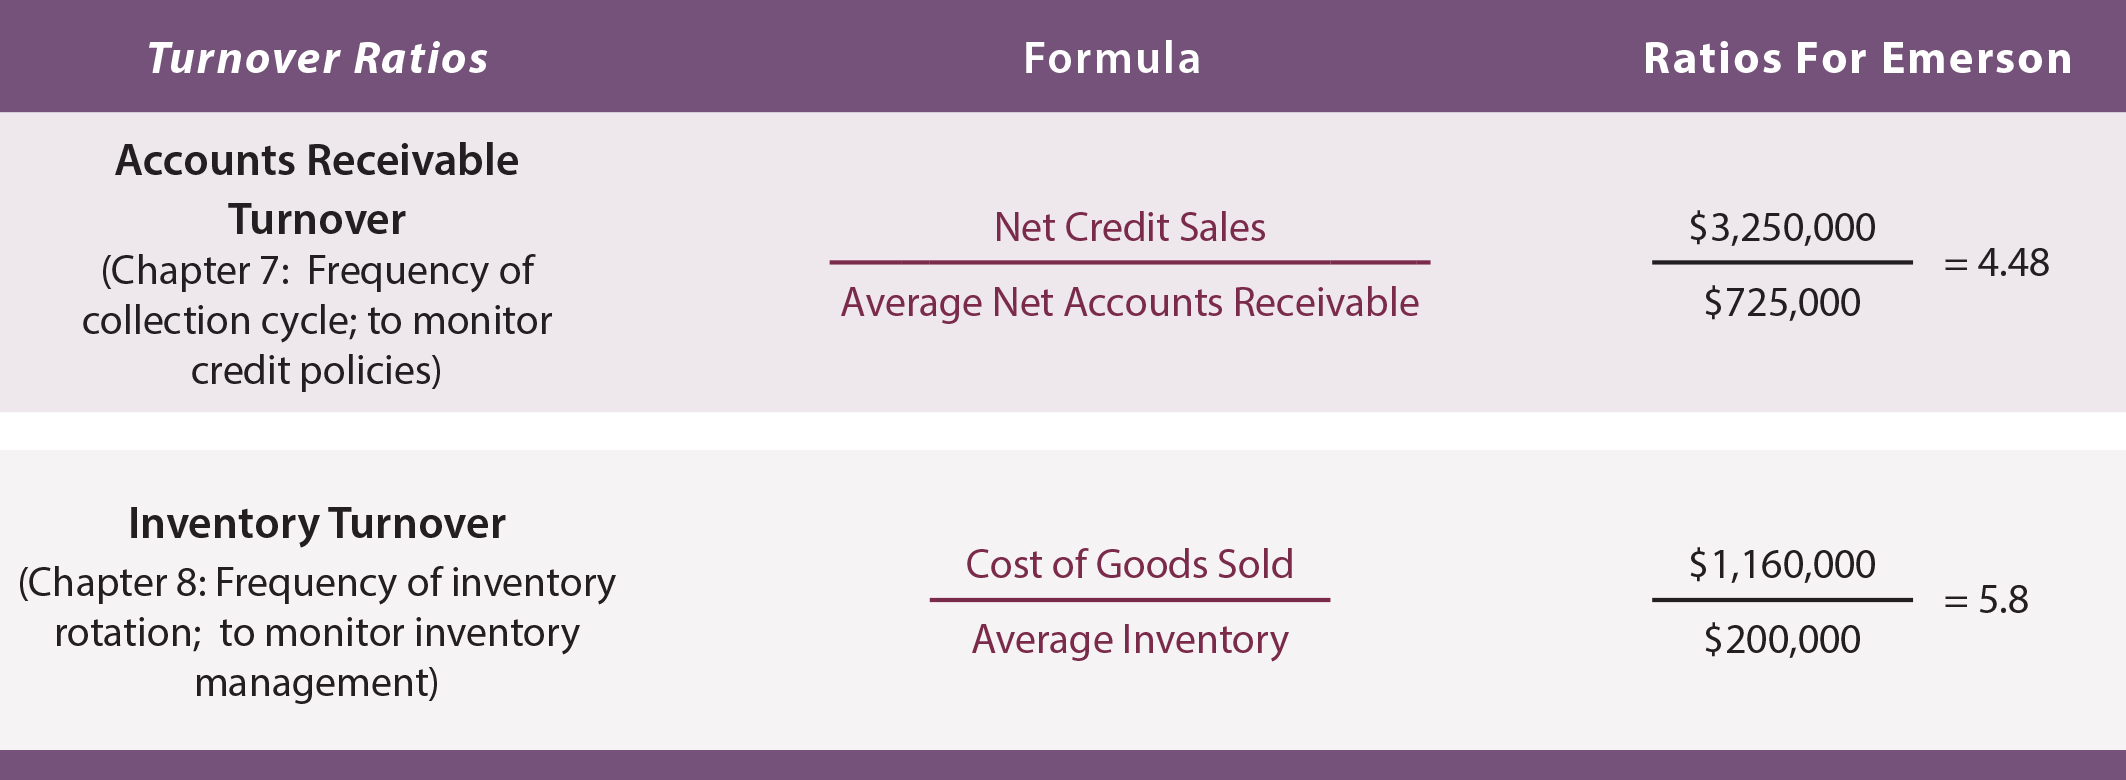
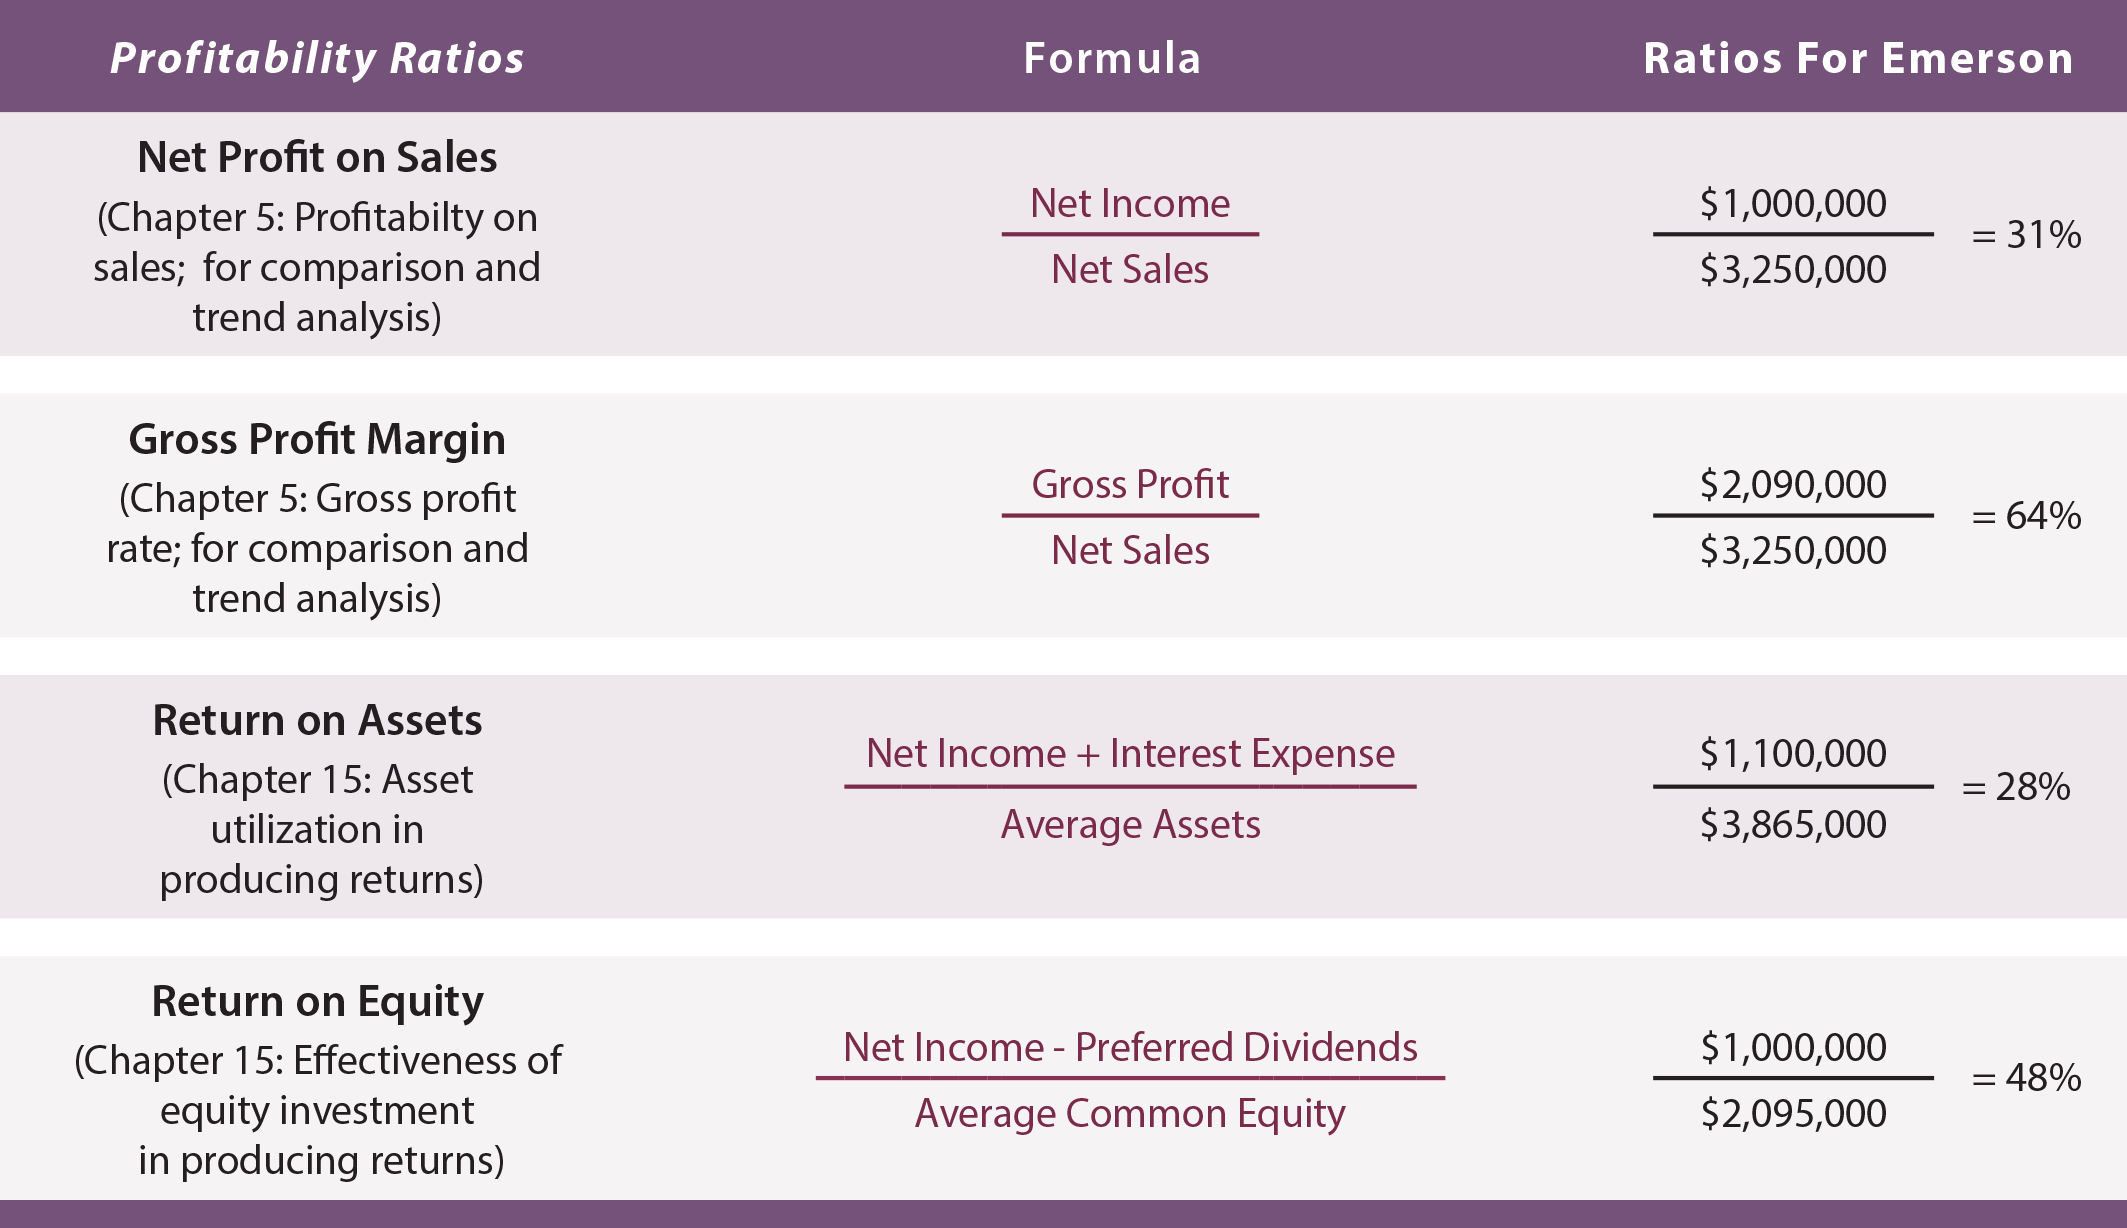
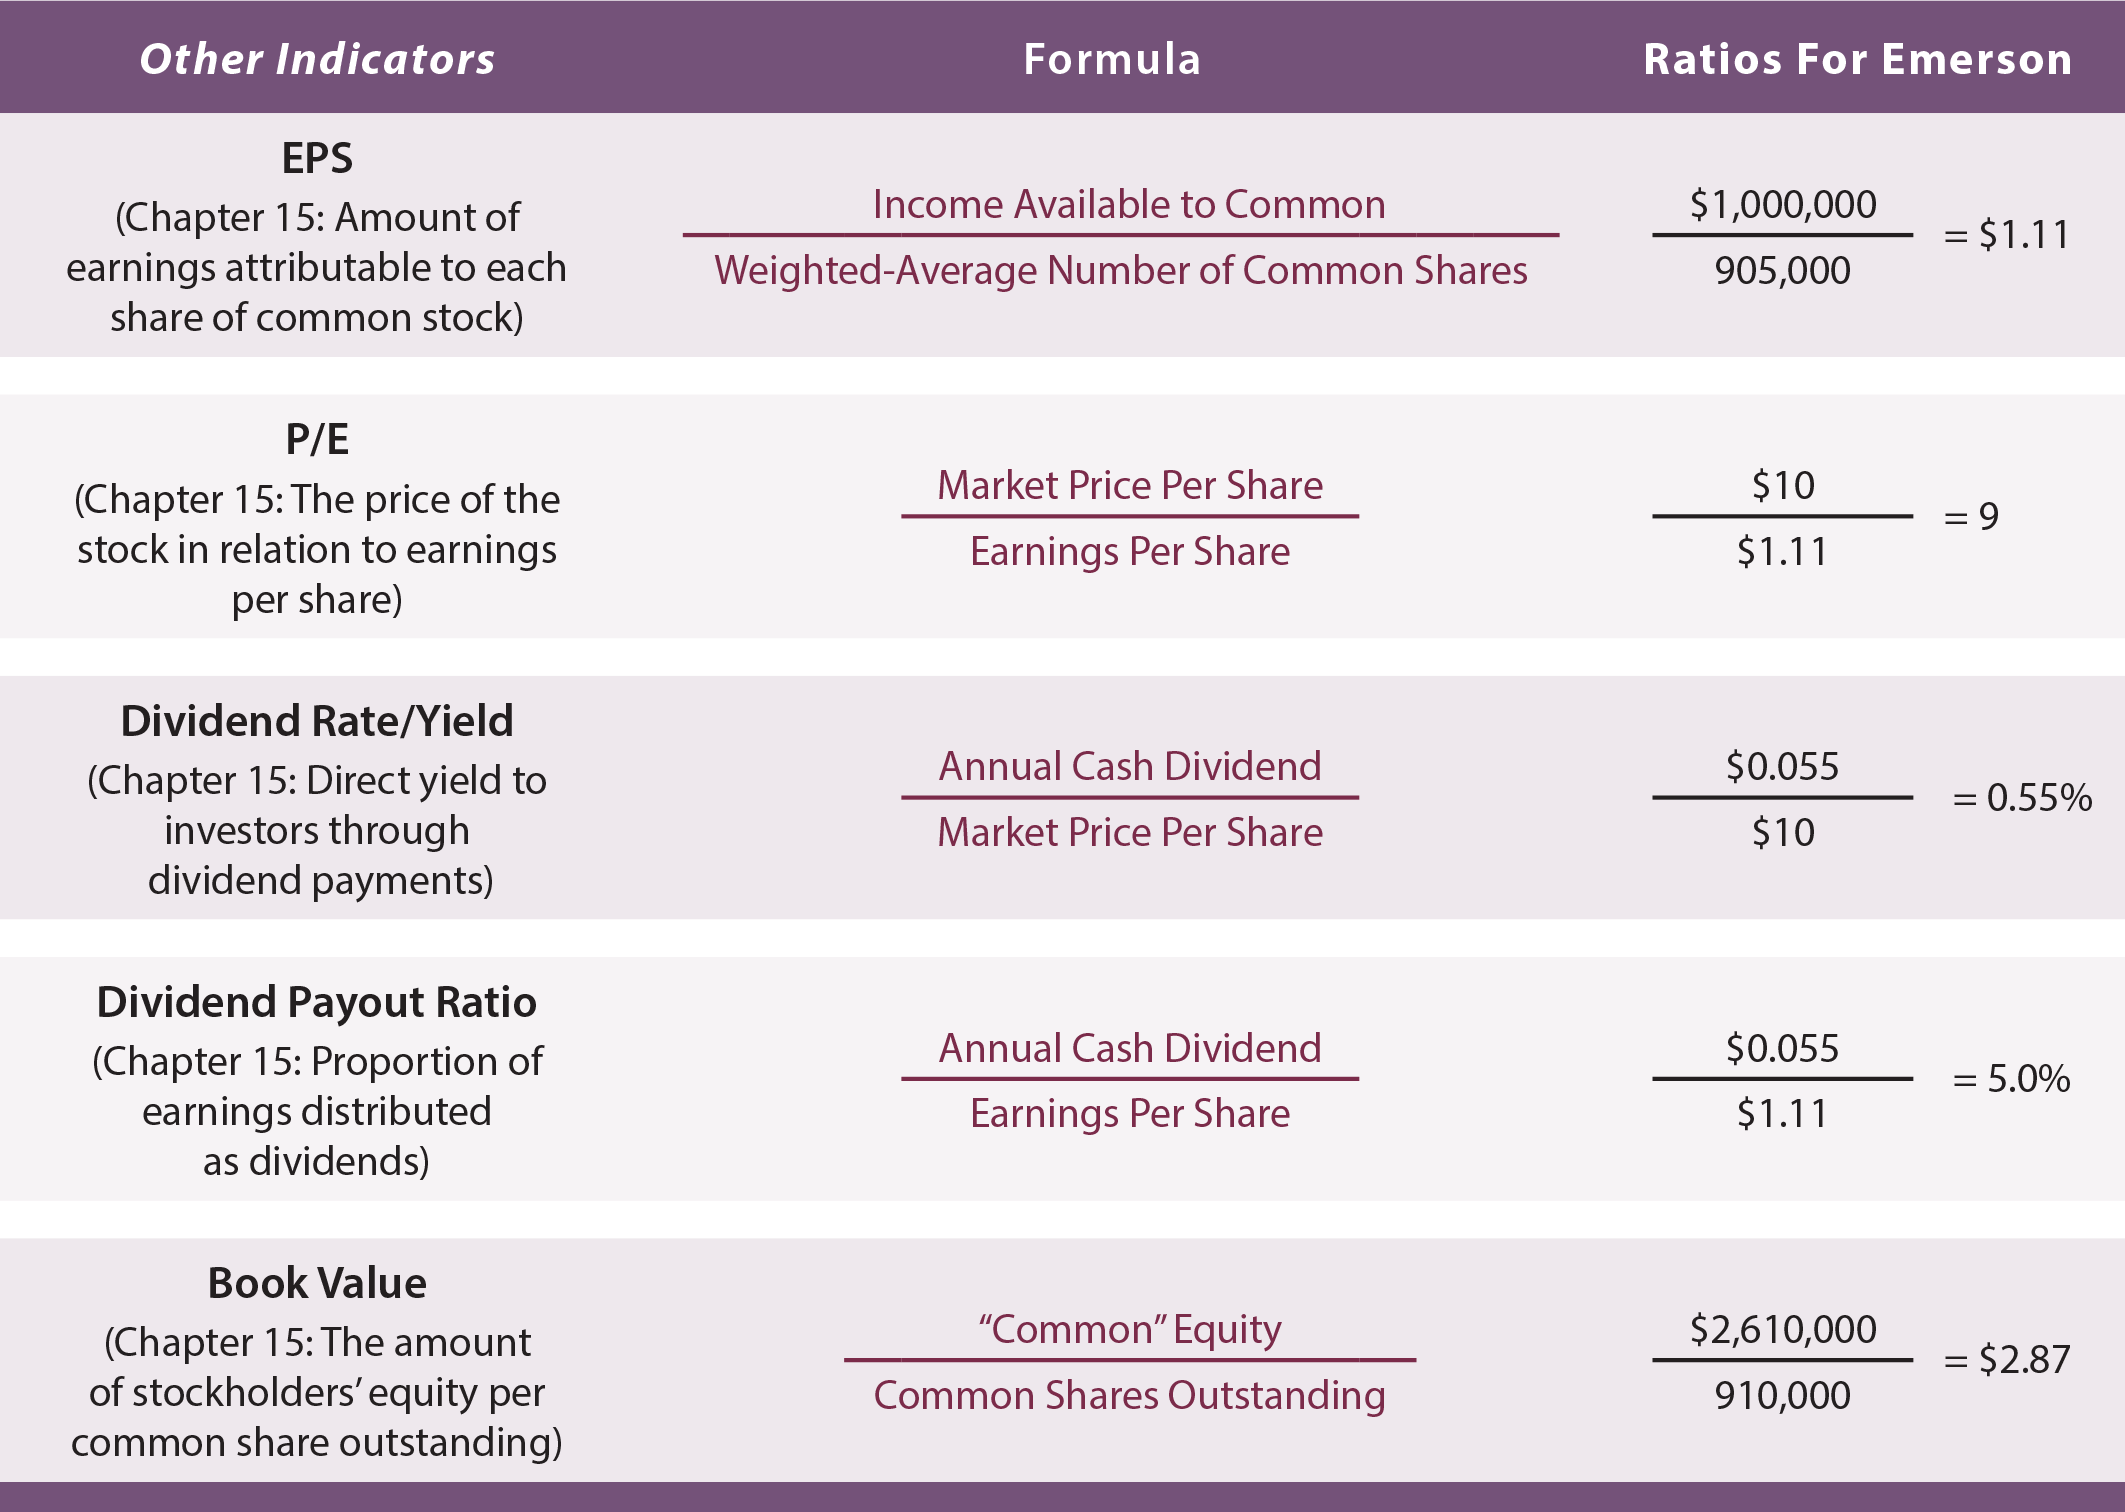
This book has introduced financial statement ratios and analysis techniques throughout many of the previous chapters. The following tables include a recapitulation of those ratios, including cross references back to chapters where the ratios were first introduced. If any of the ratios are unclear, it may prove helpful to refer back to the earlier chapters for more detail on the calculation and interpretation of the ratios. The right hand column of the tables include specific calculations for Emerson Corporation. Comprehensive financial statements for Emerson follow the tables. Be sure to verify each ratio calculation to the data included in those financial statements.
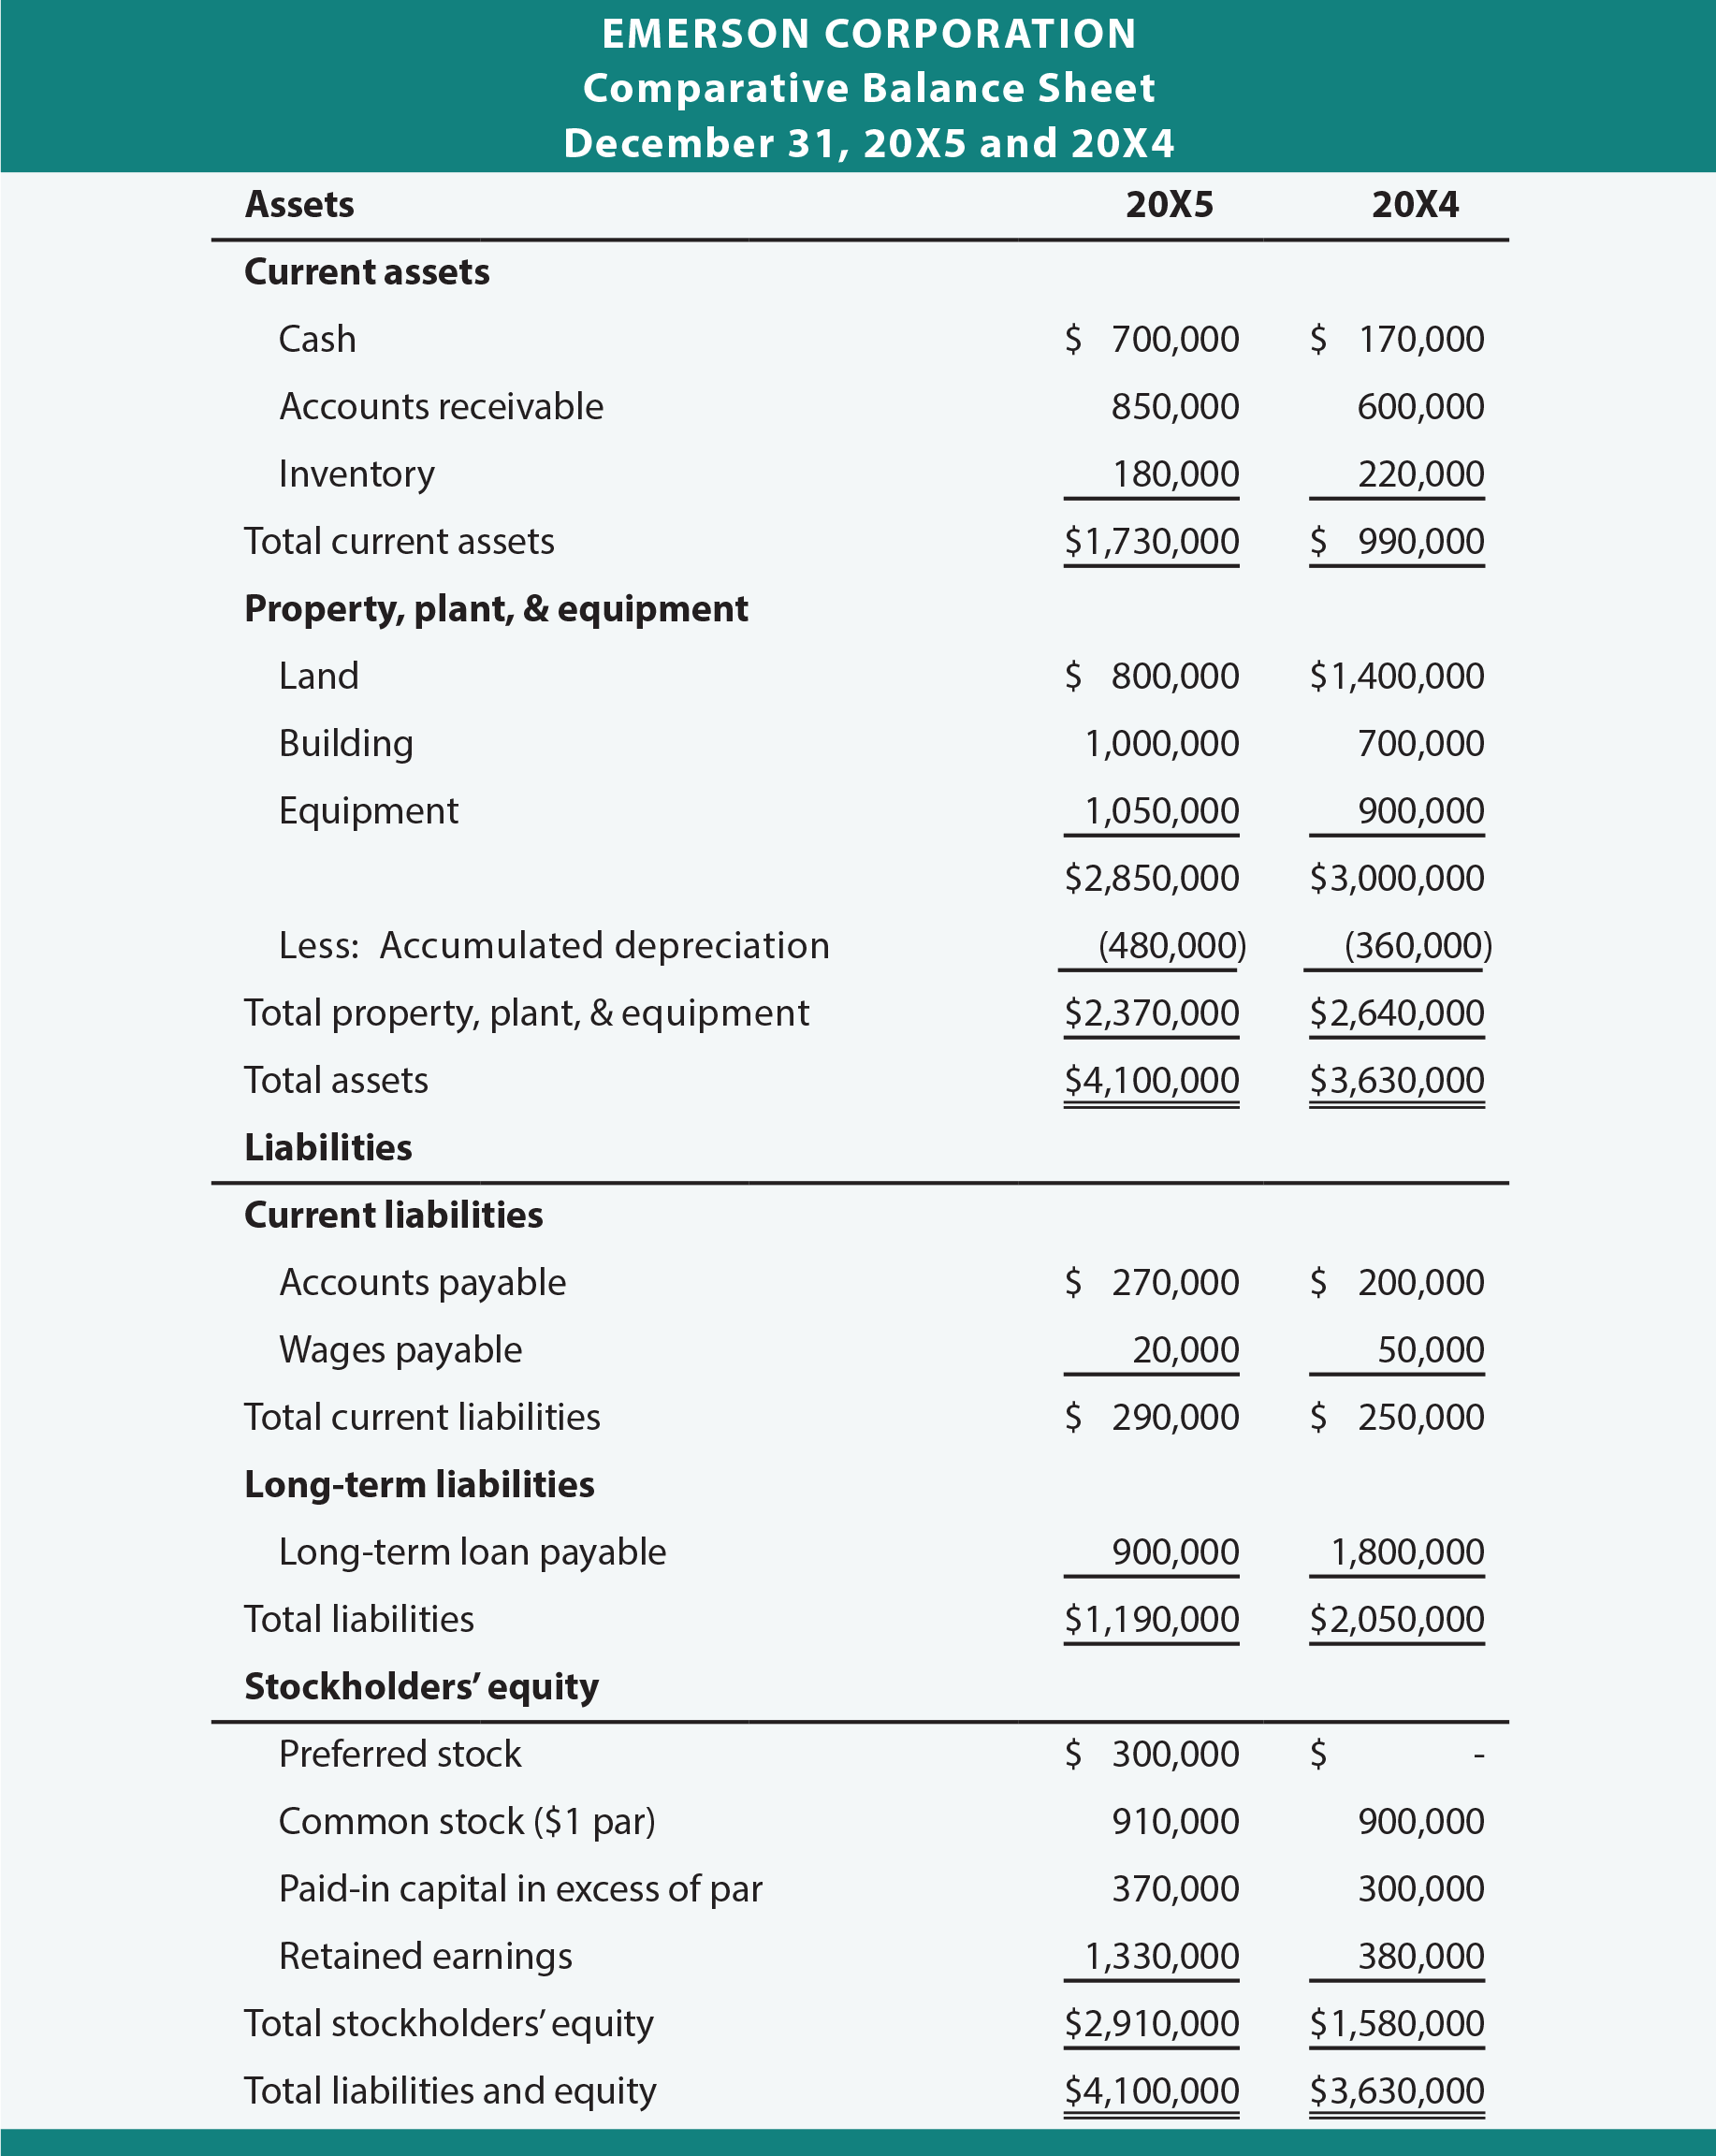
Balance Sheet
Additional Facts For Emerson
No dividends were due or paid on the $300,000 of preferred stock which was issued in exchange for a building in late 20X5. Average common equity is assumed to be $2,095,000 ((($2,910,000 – $300,000) + $1,580,000)/2). Assume most other balance sheet items change uniformly throughout the year (e.g., average receivables = ($600,000 + $850,000)/2 = $725,000, etc.). The year-end market value of the common stock was $10 per share, and the cash dividend was paid on shares outstanding at the end of the year ($50,000/910,000 shares = $0.055 per share).
It appears that Emerson is doing fairly well. Its liquidity suggests no problem in meeting obligations, the debt is manageable, receivables and inventory appear to be turning well, and profits are good.
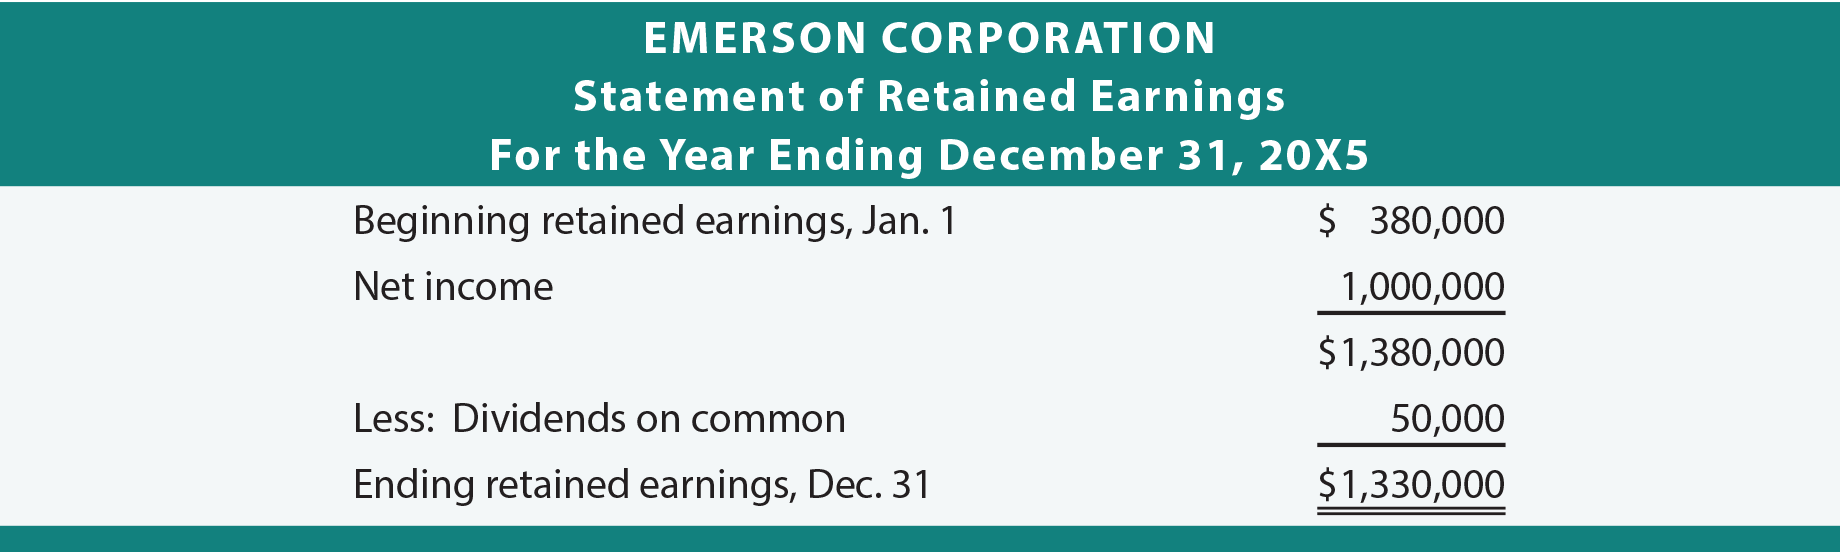
Statement Of Retained Earnings
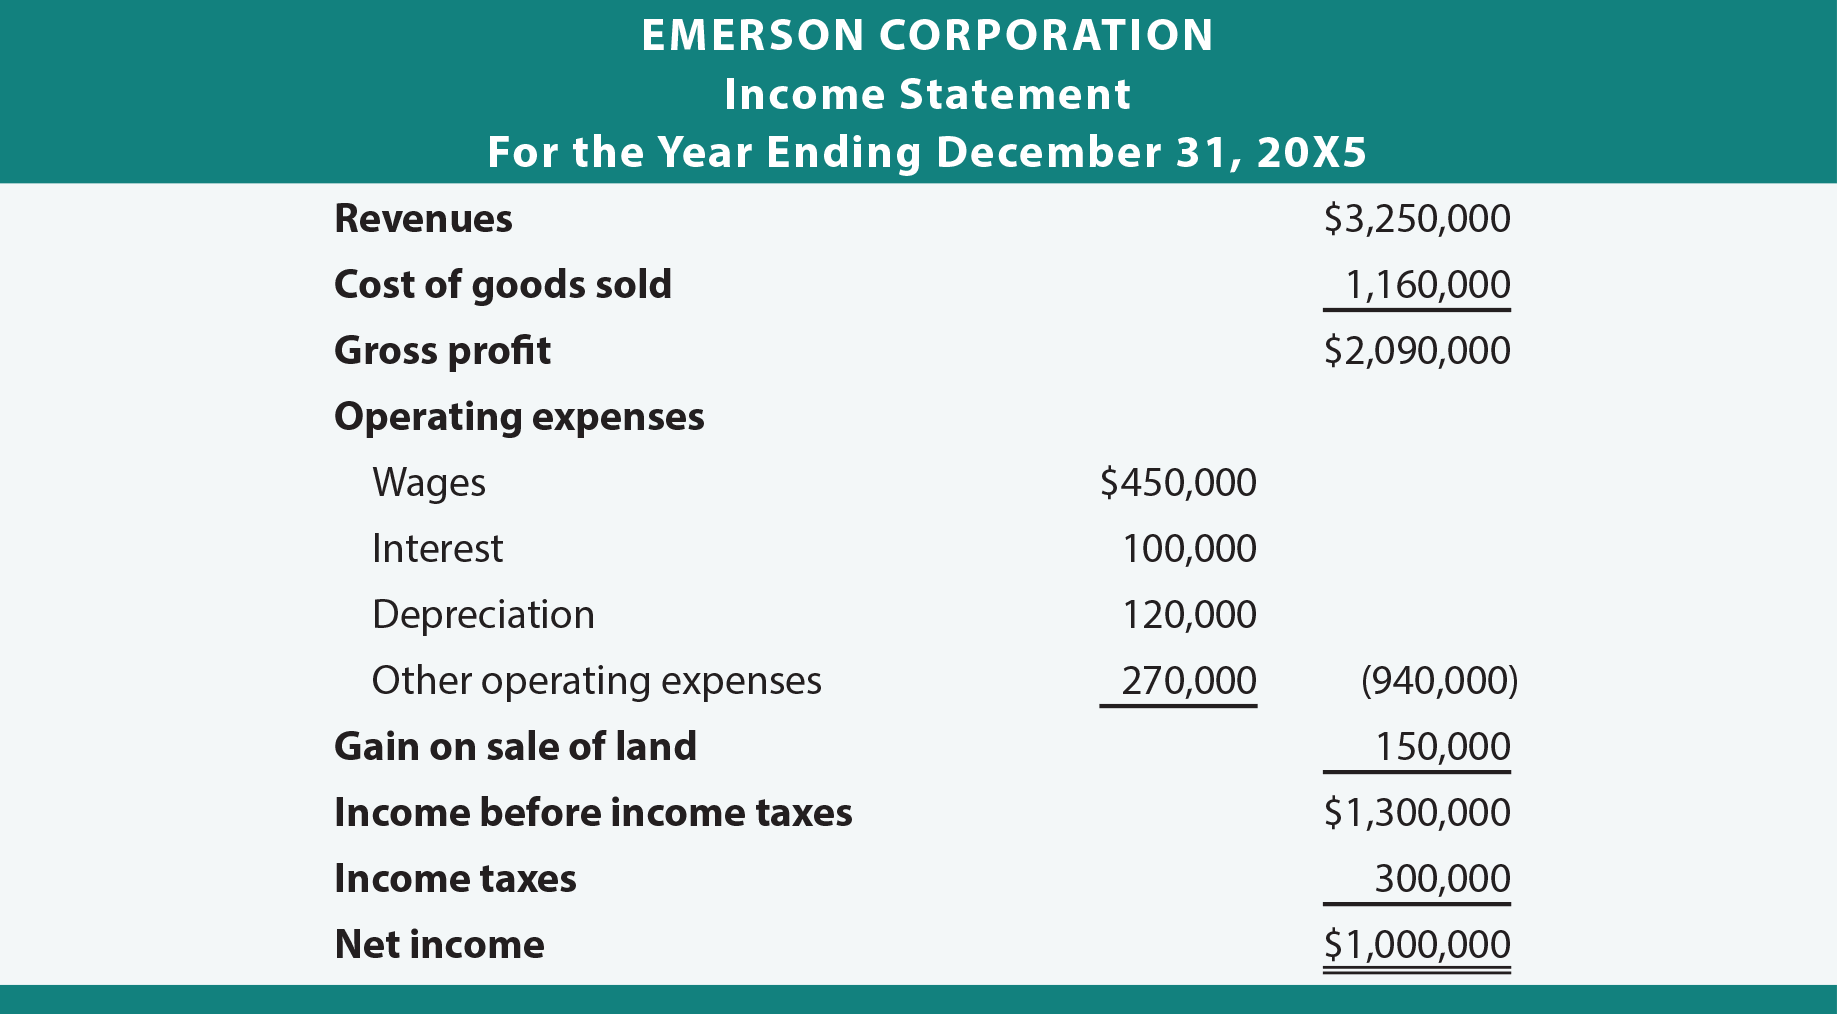
Income Statement
Trend Analysis
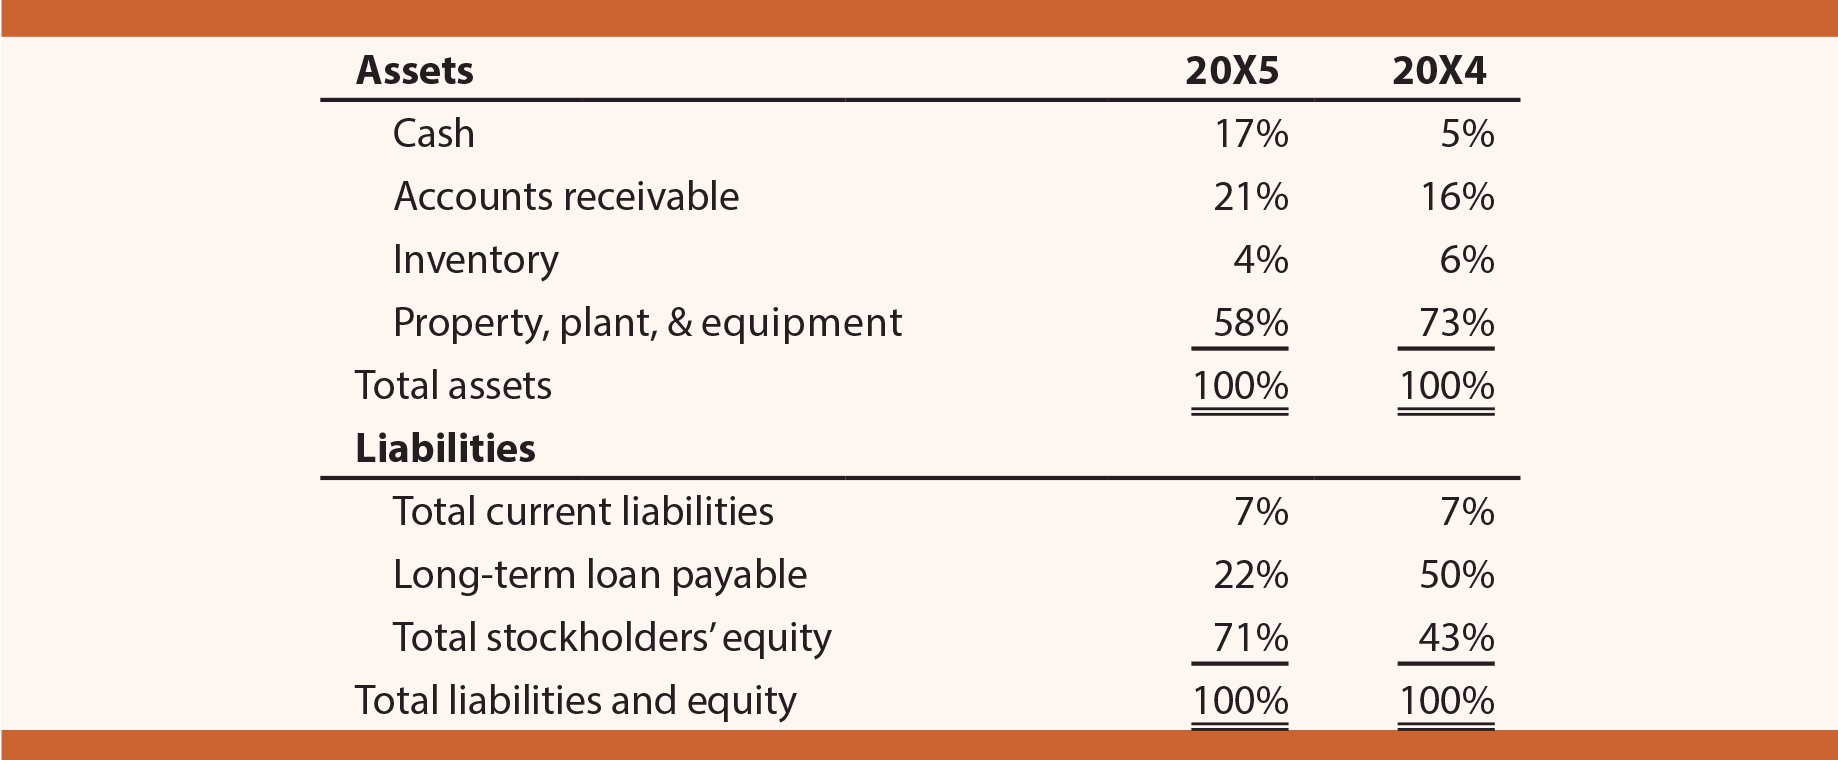
Analysts often reproduce financial statement data in percentage terms. For example, Emerson’s cash is 17% of total assets ($700,000/$4,100,000). These data provide investors and managers with a keen sense of subtle shifts that can foretell changes in the business environment. This approach is sometimes called “common size” financial statements, as applied to the balance sheet data below:
| Did you learn? |
|---|
| Know the liquidity ratios: current ratio and quick ratio. |
| Know the debt service ratios: debt to total assets, debt to total equity, and times interest earned. |
| Know the turnover ratios: accounts receivable turnover and inventory turnover. |
| Know the profitability ratios: net profit on sales, gross profit margin, return on assets, and return on equity. |
| Know other indicators: EPS, P/E, dividend rate/yield, dividend payout ratio, and book value per share. |
| Understand the importance of monitoring trends in the relationships between various financial statement components. |