 The questions and problems accompanying this text serve as a self-test to help identify areas where a student’s understanding is not clear. They provide feedback on areas where additional study is needed. Such “performance evaluations” are an important part of managing and improving one’s education. Clearly, professors rely on some form of performance evaluation in assigning grades. Through this feedback method students are able to sense areas of strength and weakness. The method also provides a key “motivator” to study and learn. Excellent students are rewarded. Poor students are signaled to work harder or consider alternative fields of study. Performance evaluations can sometimes seem harsh, but are generally viewed as necessary in striving toward an end result. Businesses must also adopt performance evaluation methods.
Earlier chapters focused on techniques used for costing products and services, understanding cost behavior, budgeting, and so forth. These basic tools and techniques are essential to a well-managed organization. But, one must also be mindful that managers must be held accountable for the results of their decisions and related execution. Without performance-related feedback, the business will not perform at its best possible level, and opportunities for improvement may go unnoticed or unrealized.
Given that managers must be held accountable for decisions, actions, and outcomes, it becomes very important to align a manager’s area of accountability with his or her area of responsibility. The “area” of responsibility can be a department, product, plant, territory, division, or some other type of unit or segment. Usually, the attribution of responsibility will mirror the organizational structure of the firm. This is especially true in organizations that have a decentralized approach to decision making.
Centralize Vs. Decentralize
 Sometimes by plan, and sometimes simply as a result of top management’s leadership style, an organization will tend to gravitate to either a centralized or a decentralized style of management. With a centralized style, the top leaders make and direct most important decisions. Lower-level personnel execute these directives but are generally powerless to independently make policy decisions. A centralized organization benefits from strong coordination of purpose and methods, but it has some glaring deficiencies. Among these are the stifling of lower-level managerial talent, suppression of innovation, and reduction in employee morale.
Many successes have occurred in highly decentralized organizations. Top management concentrates on strategy and leaves the day-to-day operation and decision-making tasks to lower-level personnel. This facilitates rapid “front-line” response to customer issues and provides for identifying and training emerging managers. It can also improve morale by providing each employee with a clear sense of importance that is often lacking in a highly centralized environment. Decentralization can prove to be a fertile ground for cultivating new and improved products and processes.
Responsibility Centers
A decentralized environment results in highly dispersed decision making. As a result, it is imperative to monitor and judge the effectiveness of each manager. This is easier said than done. Not all units are capable of being evaluated on the same basis. Some units do not generate any revenue; they only incur costs in support of some necessary function. Other units that deliver goods and services have the potential to be assessed on the basis of profit generation.
As a generalization, the part of an organization under the control of a manager is termed a responsibility center. To aid performance evaluation it is first necessary to consider the specific character of each responsibility center. Some responsibility centers are cost centers and others are profit centers. On a broader scale, some are considered to be investment centers. The logical method of assessment will differ based on the core nature of the responsibility center.
Cost Center
 Obviously most business units incur costs, so this alone does not define a cost center. A cost center is perhaps better defined by what is lacking; the absence of revenue, or at least the absence of control over revenue generation. Examples of departments that are expensive to support and do not directly contribute to revenue generation are human resources, accounting, legal, and other administrative departments. Cost centers are also present on the factory floor; maintenance and engineering fall into this category. Many businesses also consider the actual manufacturing process to be a cost center even though a saleable product is produced (the sales “responsibility” is shouldered by other units).
It stands to reason that assessments of cost control are key in evaluating the performance of cost centers. This chapter will show how standard costs and variance analysis can be used to pinpoint areas where performance is above or below expectation. Cost control should not be confused with cost minimization. It is easy to reduce costs to the point of destroying enterprise effectiveness. The goal is to control costs while maintaining enterprise effectiveness. Nonfinancial metrics are also useful in monitoring cost centers: documents processed, error rates, satisfaction surveys, and other similar measures can be used. The concept of a balanced scorecard is discussed later in this chapter, and it can be very relevant to evaluating a cost center.
Profit Center
 Some business units have control over both costs and revenues and are therefore evaluated on their profit outcomes. For such profit centers, “cost overruns” are expected if they are coupled with commensurate gains in revenue and profitability.
A restaurant chain may evaluate each store as a separate profit center. The store manager is responsible for the store’s revenues and expenses. A store with more revenue would generate more food costs; an assessment of food cost alone would be foolhardy without giving consideration to the store’s revenues. For profit centers, the flexible budgets discussed in this chapter are useful evaluative tools. Other techniques include a unit-by-unit profitability analysis using traditional financial statement ratios.
Investment Center
 At higher levels within an organization, unit managers will be held accountable not only for cost control and profit outcomes, but also for the amount of investment capital that is deployed to achieve those outcomes. In other words, the manager is responsible for adopting strategies that generate solid returns on the capital he or she is entrusted to deploy. Evaluation models for investment centers become more complex and diverse. They usually revolve around calculated rates of return.
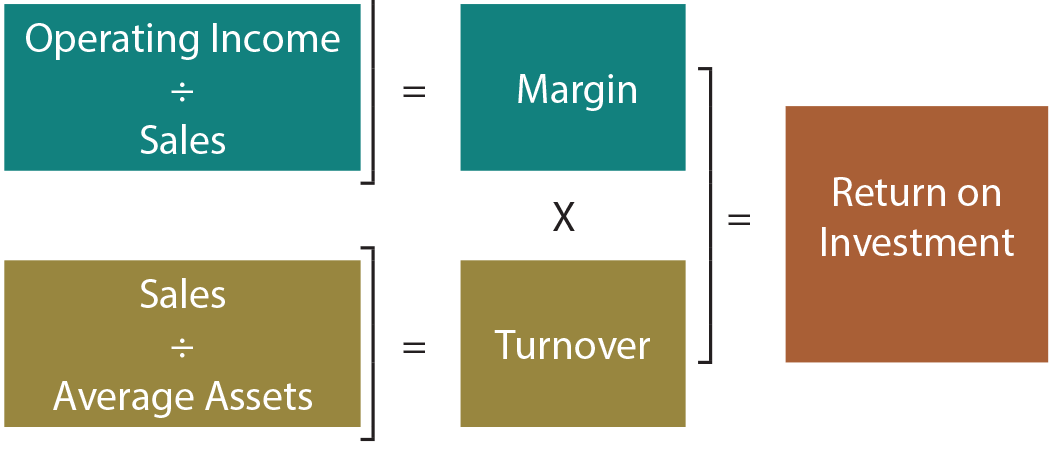
One popular method was pioneered by E. I. du Pont de Nemours and Company. It is commonly known as the DuPont return on investment (ROI) model and is pictured at right. This model consists of a margin subcomponent (Operating Income ÷ Sales) and a turnover subcomponent (Sales ÷ Average Assets). These two subcomponents can be multiplied to arrive at the ROI. A bit of algebra reveals that ROI reduces to a simpler formula: Operating Income ÷ Average Assets.
A prudent manager who is to be evaluated under the ROI model will quickly realize that the subcomponents are important. ROI can be improved by increasing sales, reducing expenses, and/or decreasing the deployed assets. The DuPont approach encourages managers to focus on increasing sales, while controlling costs and being mindful of the amount invested in productive assets. A disadvantage of the ROI approach is that some “profitable” opportunities may be passed by managers because they fear potential dilution of existing successful endeavors.
Nexus of Control
 Lower-level managers may only be responsible for a small subset of business activities. As such, they should only be held accountable for results of their specific business unit. As one moves higher within the organizational chart, mid- and upper-level managers naturally assume ever greater degrees of responsibility. The reporting system should mimic the expanded scope and develop information that reveals the performance for all units within the nexus of control of a particular manager. At successively higher steps, individual performance reports are combined to reveal the success or failure of all activities beneath a particular manager. This can result in one manager being held accountable for a combination of cost, profit, and investment centers. A keen manager must be familiar with the specific techniques for managing and gauging the success of each.
Case Study
 Out To Lunch is a rapidly growing fast-food restaurant chain. Its business model revolves around a uniquely flavored hamburger and a very simple menu consisting of a hamburger, fries, and drinks. It provides simple “round number” pricing, few products, and rapid service. Out To Lunch also has a catering service for sporting events, corporate outings, and similar occasions.
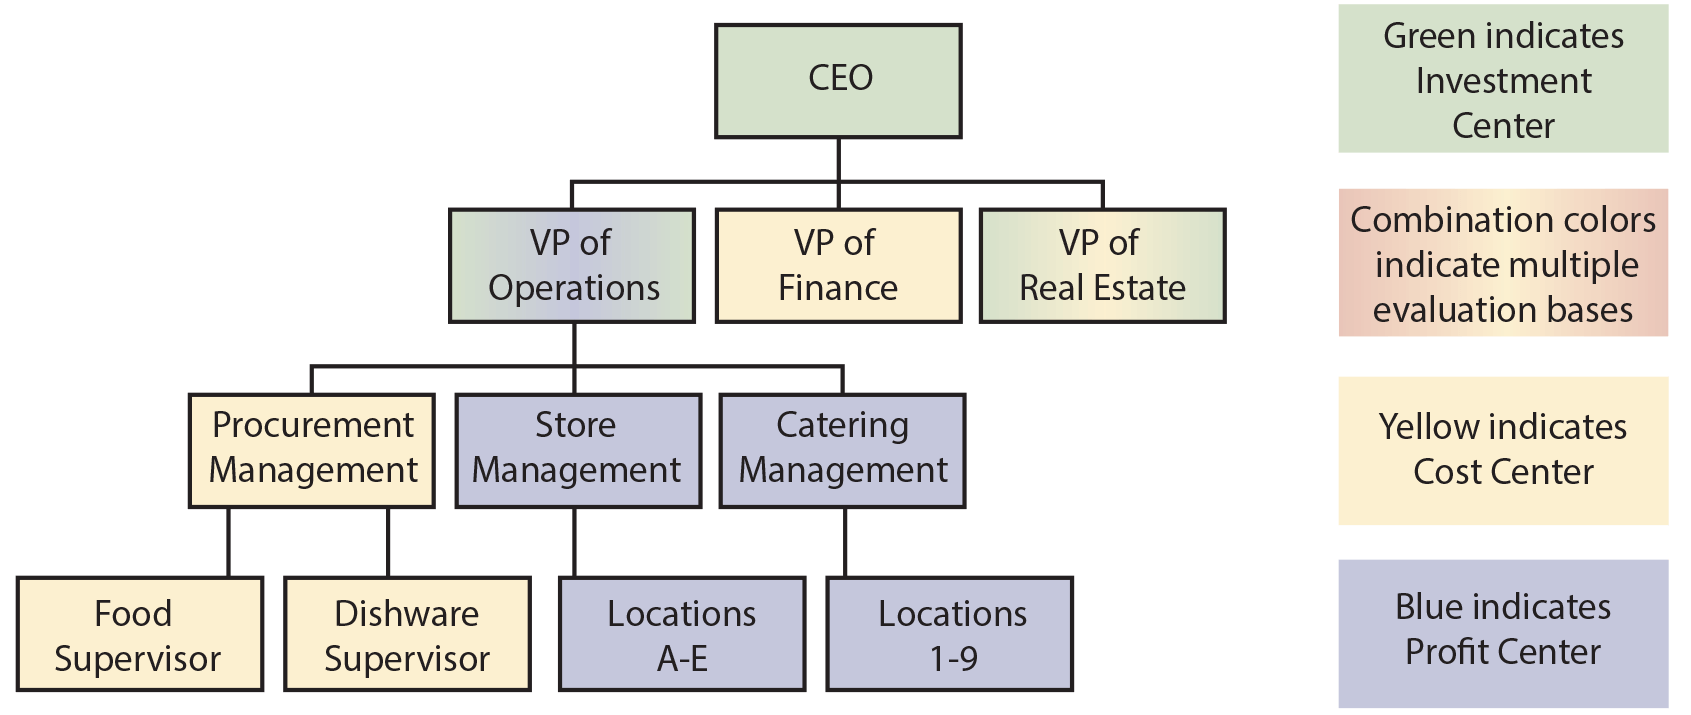
Following is an organization chart for Out To Lunch. The block colors in the organization chart indicate the character of performance/responsibility evaluation that is part of each position. The Chief Executive Officer reports to the owners, and the owners are primarily interested in their return on investment. Three vice presidents report to the CEO:
- The VP of Operations is responsible for the overall investment in operations, which is driven heavily by the combined profits of each store. The VP of Operations oversees procurement, store management, and catering management. The Procurement Manager oversees purchasing of food and dishware. These activities are evaluated as cost centers, relying on budgets and standard costs to control activities. The Store and Catering managers oversee supervisors from each location. These managers are responsible for producing profits and are evaluated accordingly.
- The VP of Finance is viewed and evaluated as a cost center.
- The VP of Real Estate is responsible for site acquisition and construction. Although the activities are largely viewed in the context of a cost center, there is an expected rate of return for each new real estate investment. Therefore, the VP of Real Estate is evaluated for cost control and return on investments.
Reporting
A company’s accounting system should support preparation of an accounting report for each responsibility center. This information is essential to monitor, control, and direct each business unit. Oftentimes, the reports will provide a comparison between budgeted and actual data, with the difference being reported as a variance. These reports should be consistent with the organizational structure of the firm. At higher levels, the reports tend to include less transaction-specific detail and more combinations of business units. For Out To Lunch, each store may have a customized performance report as shown:
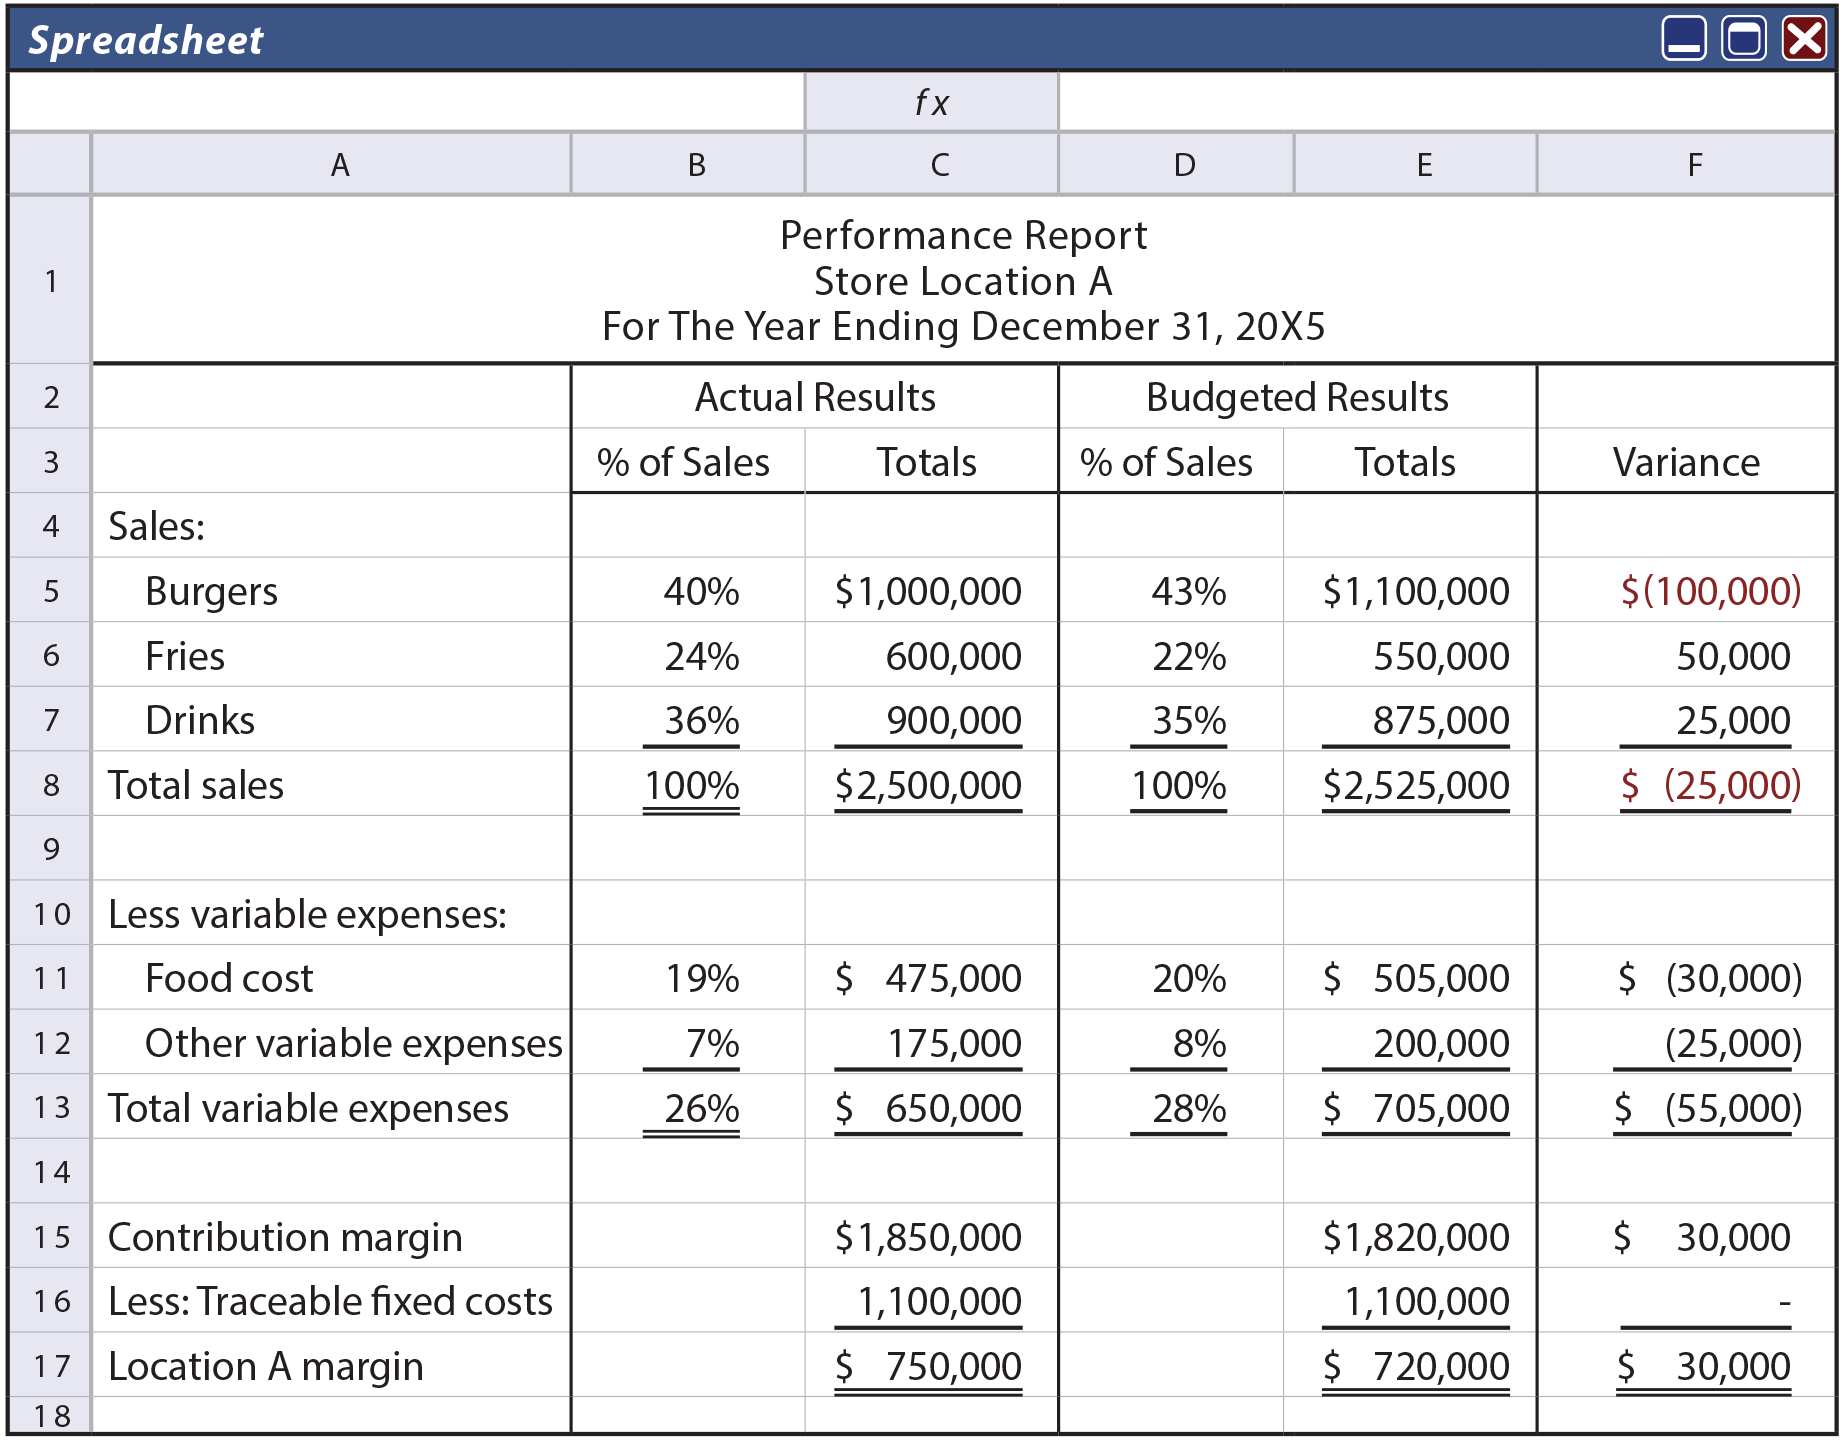
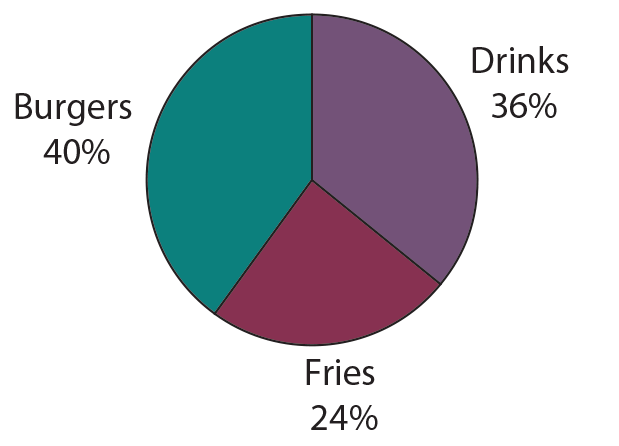 Location A’s performance report provides a basis for analysis of numerous facets of the business. Graphics can be used to facilitate understanding. For example, each store supervisor knows that fries and drinks have the highest profit margins and is encouraged to train employees to sell these items by asking customers “what type of drink did you prefer?” As a result, the report is “specialized” to show the product mix proportions. In addition, each manager gets a bonus if food costs are below 20% of sales. This incentive is designed to reduce food waste and encourage sales of high-margin products. The report provides detail to show if the objectives are met. Notice that unfavorable variances are highlighted in red. Location A did not meet the budgeted goal for hamburger sales. But, the profit objectives were nevertheless exceeded because the product mix of fries and drinks produced offsetting higher margins. Location A also managed to contain other variable costs.
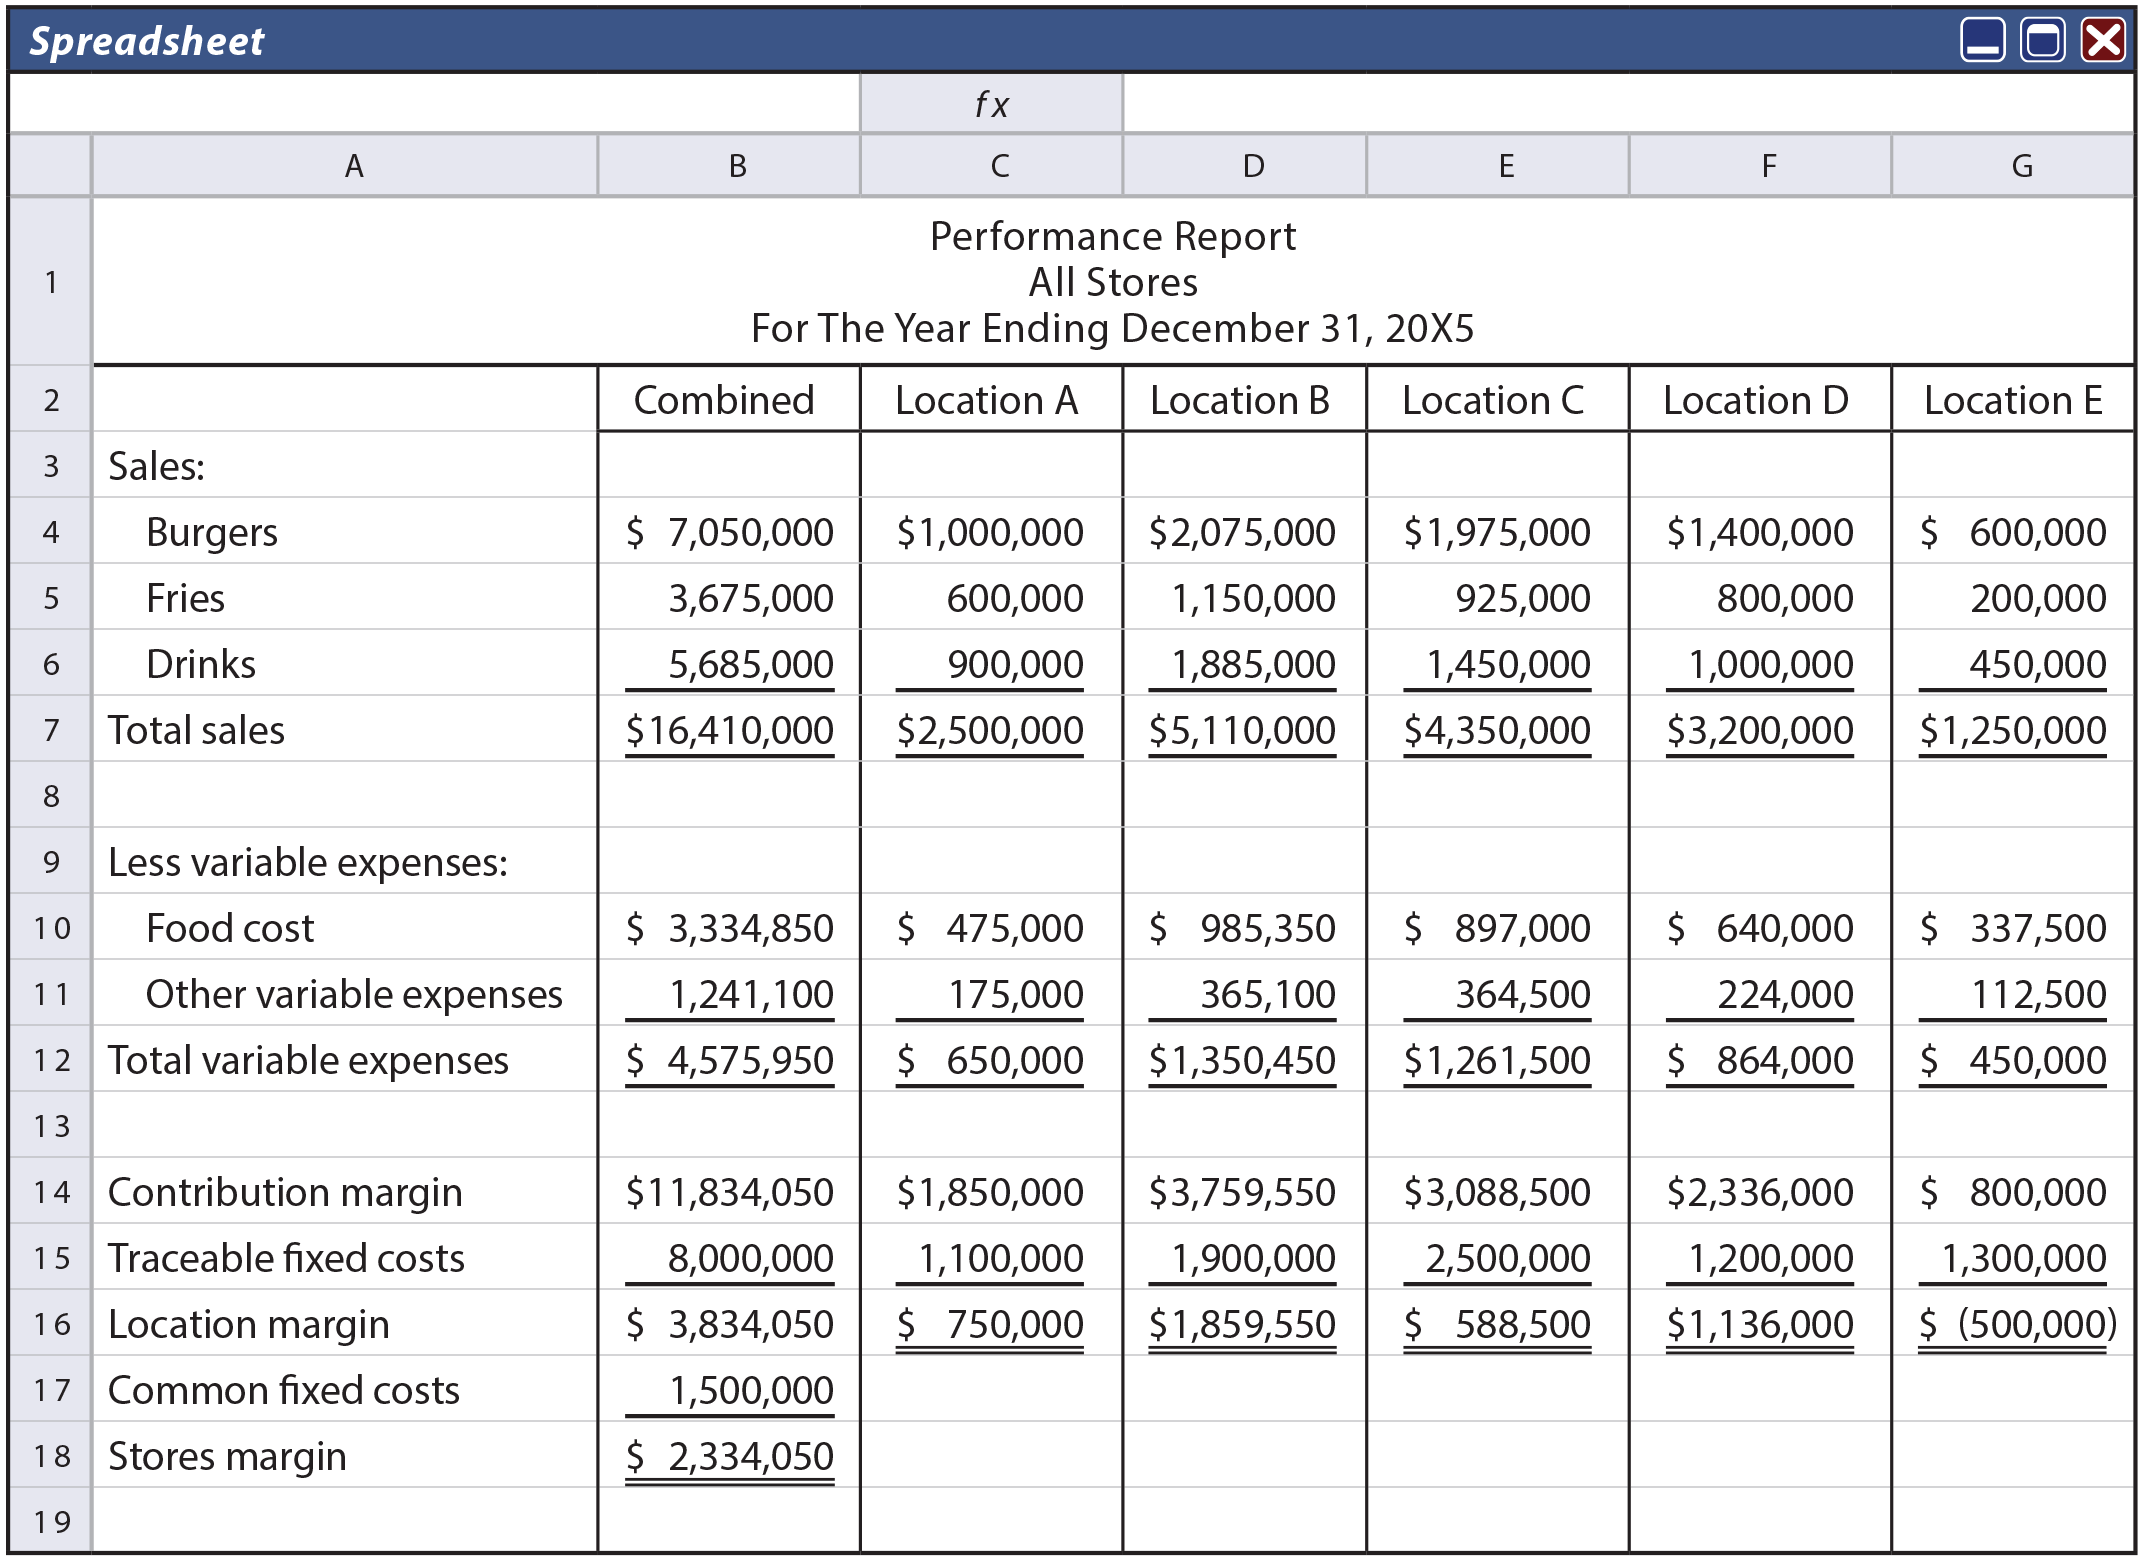
The next step up in the organizational chart is the Senior Manager of Store Operations. This person is concerned with making sure that each unit is profitable. Underperforming stores are identified, problems are studied, and corrective measures are taken. Very little time is spent on locations that are meeting or exceeding corporate profit goals. Although this manager has access to the detailed reports for each store, the performance report of interest is a compilation of summary data for each location that quickly highlights the areas of needed improvement. Review the following performance report, noting the carry forward of Location A’s data into the report. Obviously, some stores are performing much better than others. The senior manager will certainly want to focus on store E immediately! Also notice that there is $1,500,000 of fixed costs associated with store operations that is not traceable to any specific location; nevertheless, the senior manager of store operations must control this cost, and it is subtracted in calculating the overall margin. Thus, the total fixed cost for all store operations is $9,500,000 ($8,000,000 + $1,500,000).
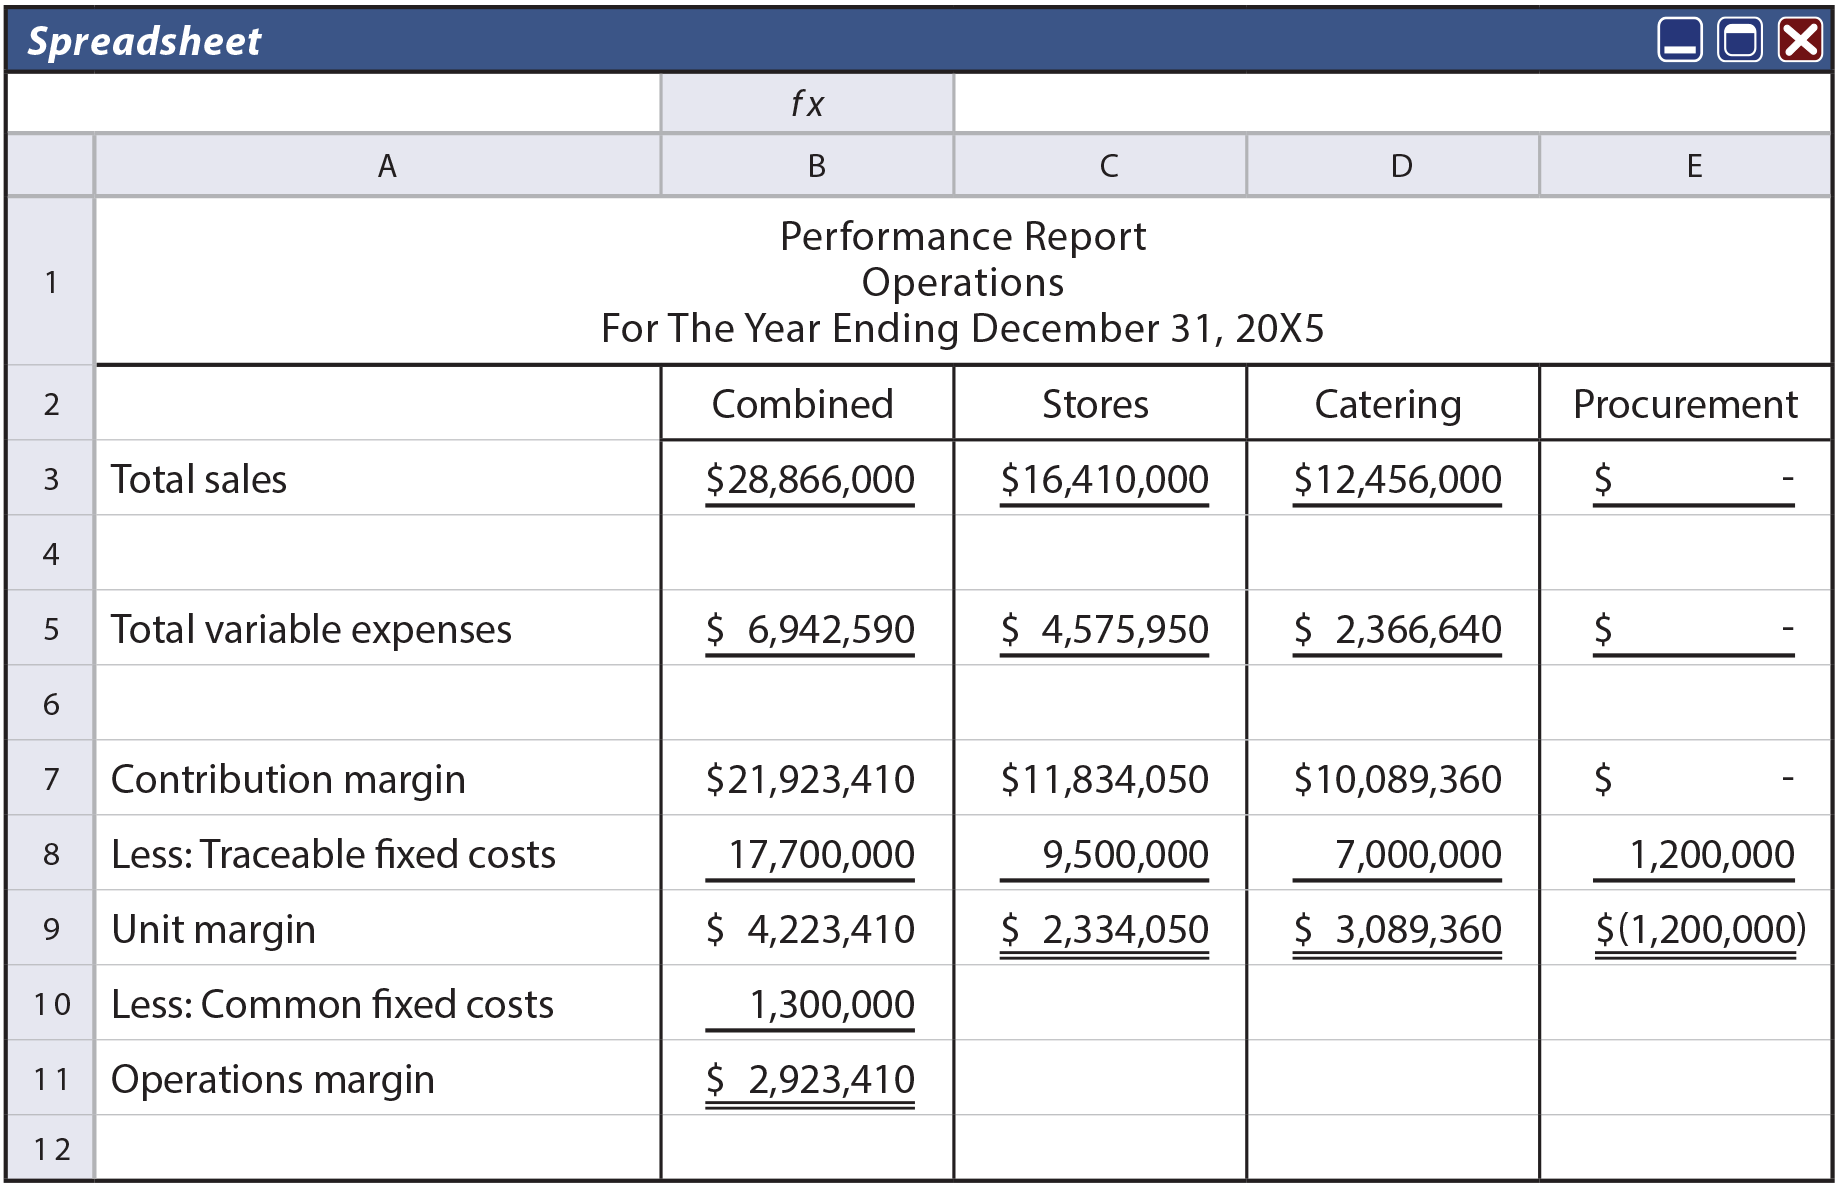
Continuing up the organizational chart, the VP of Operations will focus on summary data from store, catering, and procurement management. Notice that the “stores” column is derived from information found in the “combined” column (from the performance report for all stores). Again, note the presence of fixed costs that are not traceable to any specific operating segment ($1,300,000). Even though this cost is not assigned to a specific segment, it remains a cost for which the VP of Operations is responsible.
The CEO would have access to all reports from within the organization, but would mostly focus on reports emanating from each vice president. Management will tend to focus on areas where corrective measures are necessary. This is generally referred to as management by exception.
Traceable Vs. Common Fixed Costs
The preceding reports separated fixed expenses between those that were traceable to a specific business unit and common fixed costs. Traceable fixed costs would not exist if the unit under evaluation ceased to exist. Common fixed costs support the operations of more than one unit. Great care must be taken in distinguishing between the two. Effective performance evaluations require a clear alignment of responsibility and accountability. To the extent a unit manager is burdened with allocations of common costs, poor signaling of performance can result.
Database Systems
 The illustrated reports are useful, but do suffer from a limitation. It is sometimes difficult to “mine data” pertinent to a specific inquiry. For example, if the VP of Operations wanted to know the overall corporate sales mix (hamburgers:fries:drinks), a specific request would be initiated to the store and catering managers. Each manager would need to gather individual reports from each location and develop a combined report to channel back up to the VP. This is very inefficient and may have the undesirable outcome of forcing management to make decisions based on incomplete information. Increasingly, companies are developing customized electronic database systems that capture data and store it in such a way as to enable accurate and real time retrieval of information relevant to an almost endless number of potential questions.
| Did you learn? |
|---|
| Differentiate between centralized and decentralized decision making business structures. |
| Define responsibility centers and concepts of responsibility accounting. |
| Distinguish between cost centers, profit centers, and investment centers. |
| How is return on investment (ROI) calculated? |
| What is a performance report and how does it align with units of responsibility? |
| Define traceable fixed costs. |
| Define common fixed costs. |
| Define the concept of management by exception. |