Unlike retailers, manufacturers have three unique inventory categories: Raw Materials, Work in Process, and Finished Goods. Following is the inventory section from the balance sheet of a typical manufacturer:

For this company, observe that finished goods is just a small piece of the overall inventory. Finished goods is the cost assigned to completed products awaiting sale to a customer. But, this company has a more significant amount of raw materials (i.e., the components that will be used in manufacturing units that are not yet started) and work in process. Work in process is the account most in need of clarification. This account is for the cost of goods that are in production but not yet complete; it contains an accumulation of monies spent on direct material (i.e., the raw materials that have been put into production), direct labor, and applied manufacturing overhead.
Recall these formulations: Beginning Inventory + Purchases = Cost of Goods Available for Sale, and Cost of Goods Available for Sale – Ending Inventory = Cost of Goods Sold. These relations were necessary to calculate the cost of goods sold for a company with only one category of inventory.
For a manufacturer with three inventory categories, these “logical” formulations must take on a repetitive nature for each category of inventory. Typically, this entails a detailed set of calculations/schedule for each of the respective inventory categories. Don’t be intimidated by the number of schedules, as they are all based on the same concept.
Schedule Of Raw Materials
Focusing first on raw material, a company must determine how much of the available supply was transferred into production during the period. The following schedule illustrates this process for Katrina’s Trinkets, a fictitious manufacturer of inexpensive jewelry.
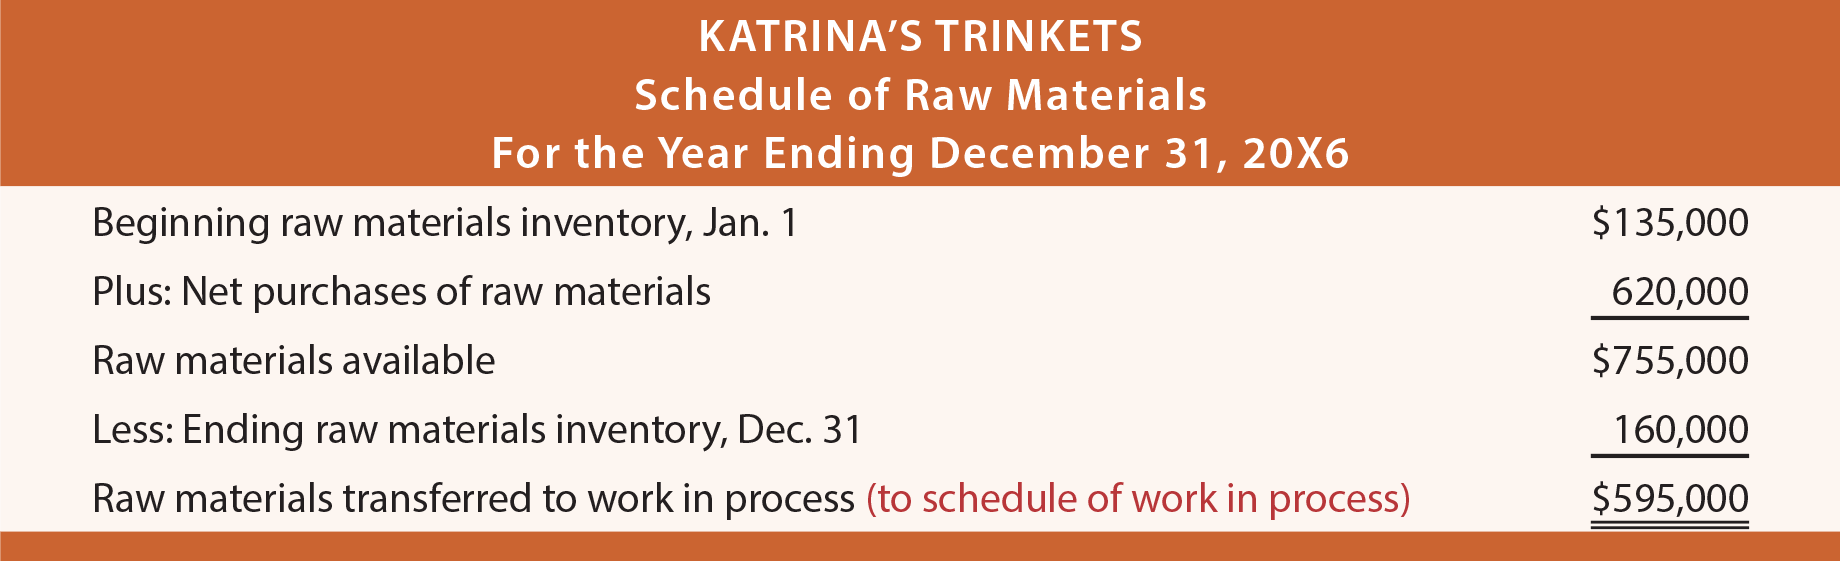
The amounts in the schedule are all “made up” to support the example. In a real world scenario, the beginning and ending inventory amounts would be supported by a physical inventory and the purchases determined from accounting records. Or, Katrina might utilize a sophisticated perpetual system that tracks the raw material as it is placed into production. Either way, the schedule summarizes the activity for the period and concludes with the dollar amount attributed to raw materials that have flowed into the production cycle. This material transferred to production then reappears in the schedule of work in process that follows.
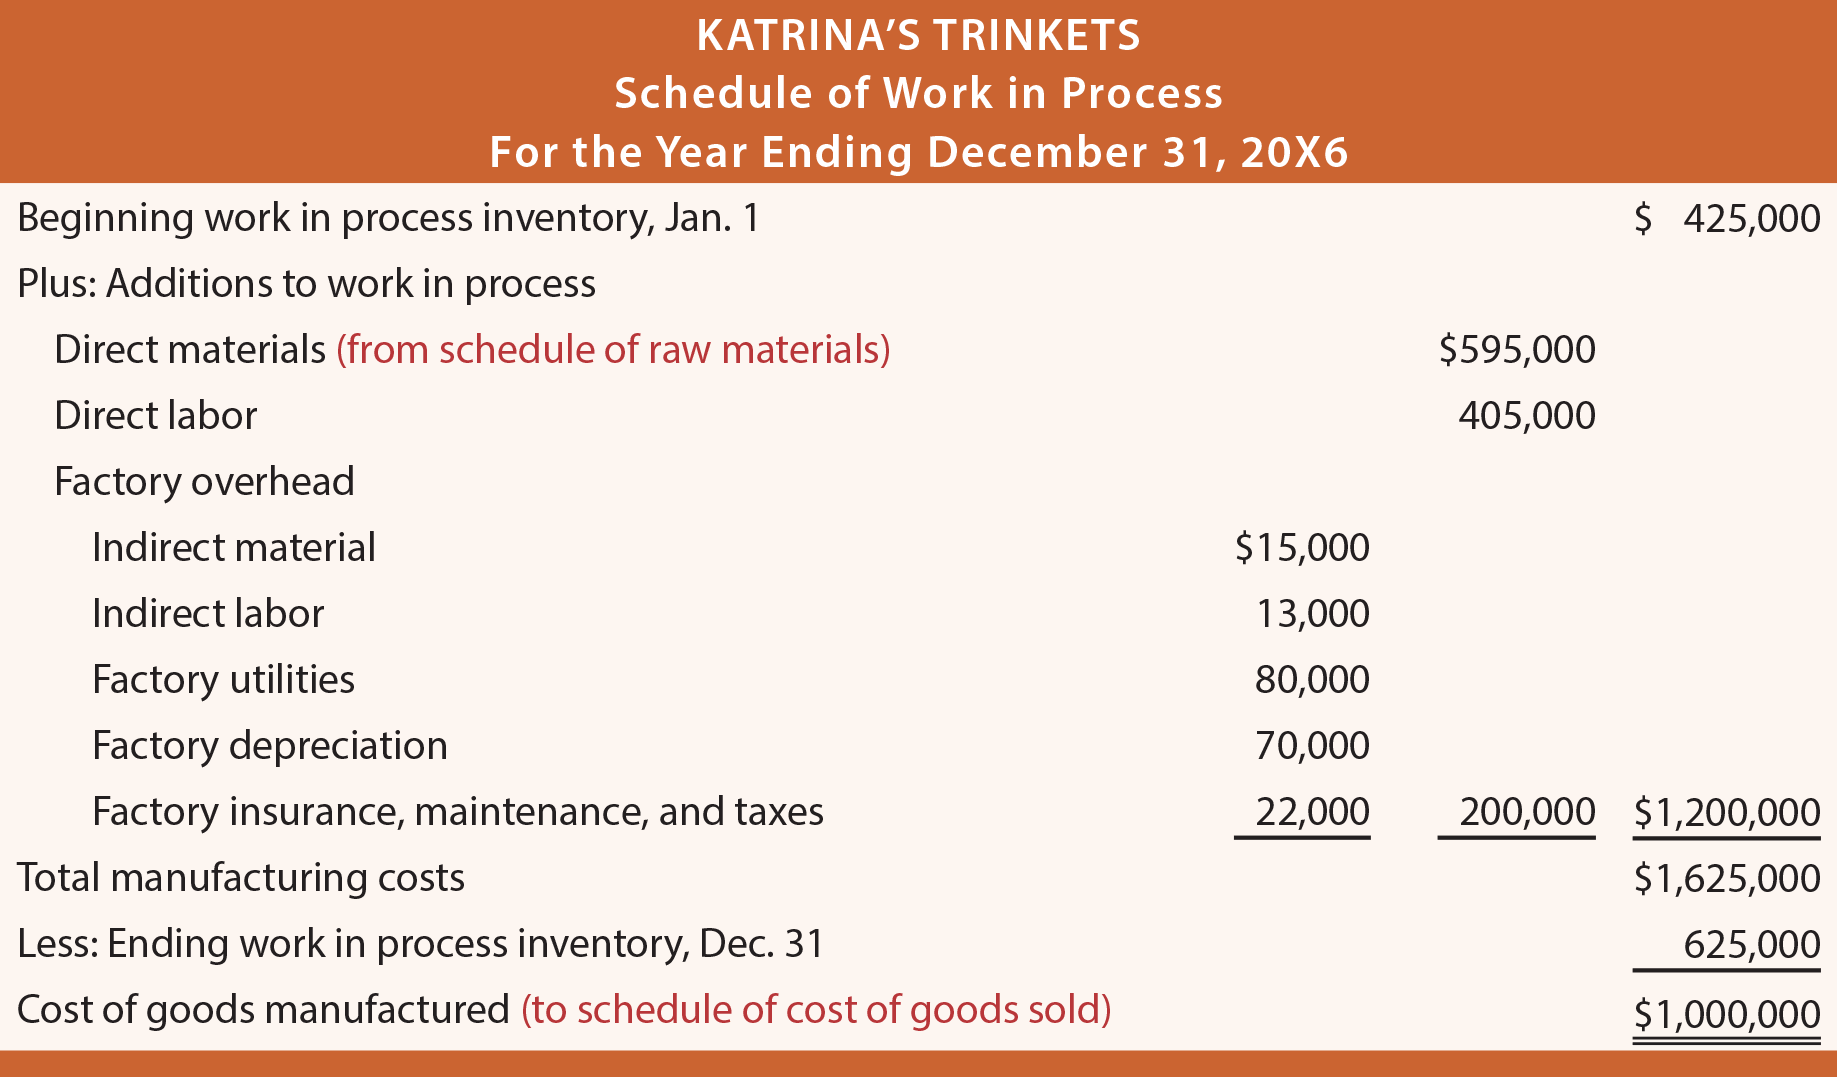
Schedule Of Work In Process
The following schedule presents calculations that pertain to work in process. Pay attention to its details, noting that (1) direct materials flow in from the schedule of raw materials, (2) the conversion costs (direct labor and overhead) are added into the mix, and (3) the cost of completed units to be transferred into finished goods is called cost of goods manufactured. Katrina’s amounts are assumed, but actually would be derived from accounting records and/or by a physical counting process.
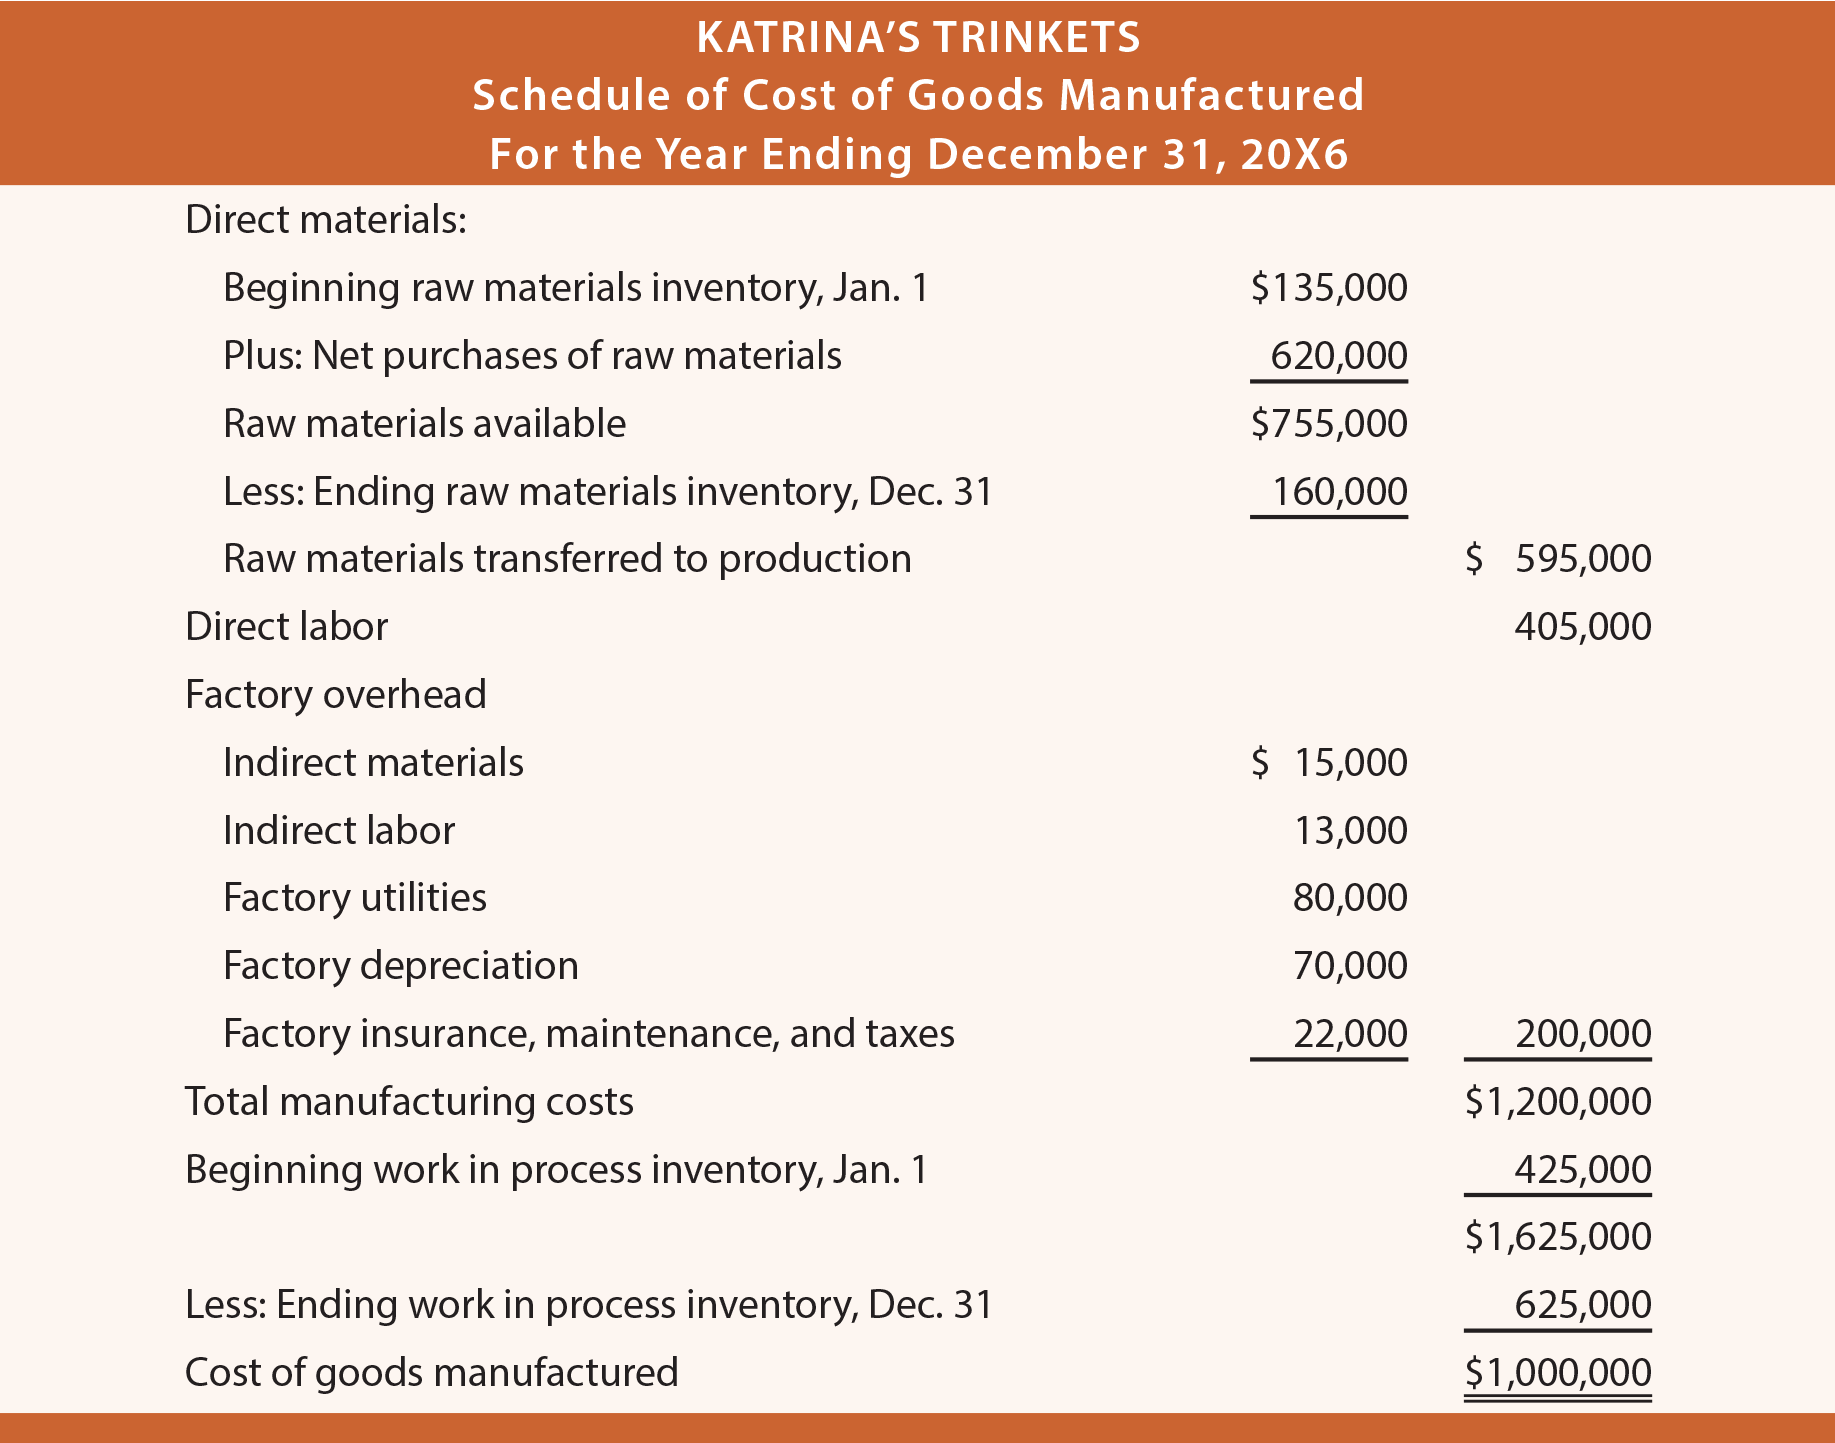
Combined Schedule
The schedules of raw materials and work in process are often combined into a single schedule of cost of goods manufactured. This schedule contains no new information from that presented in the prior two schedules; it is just a combination and slight rearrangement of the separate schedules.
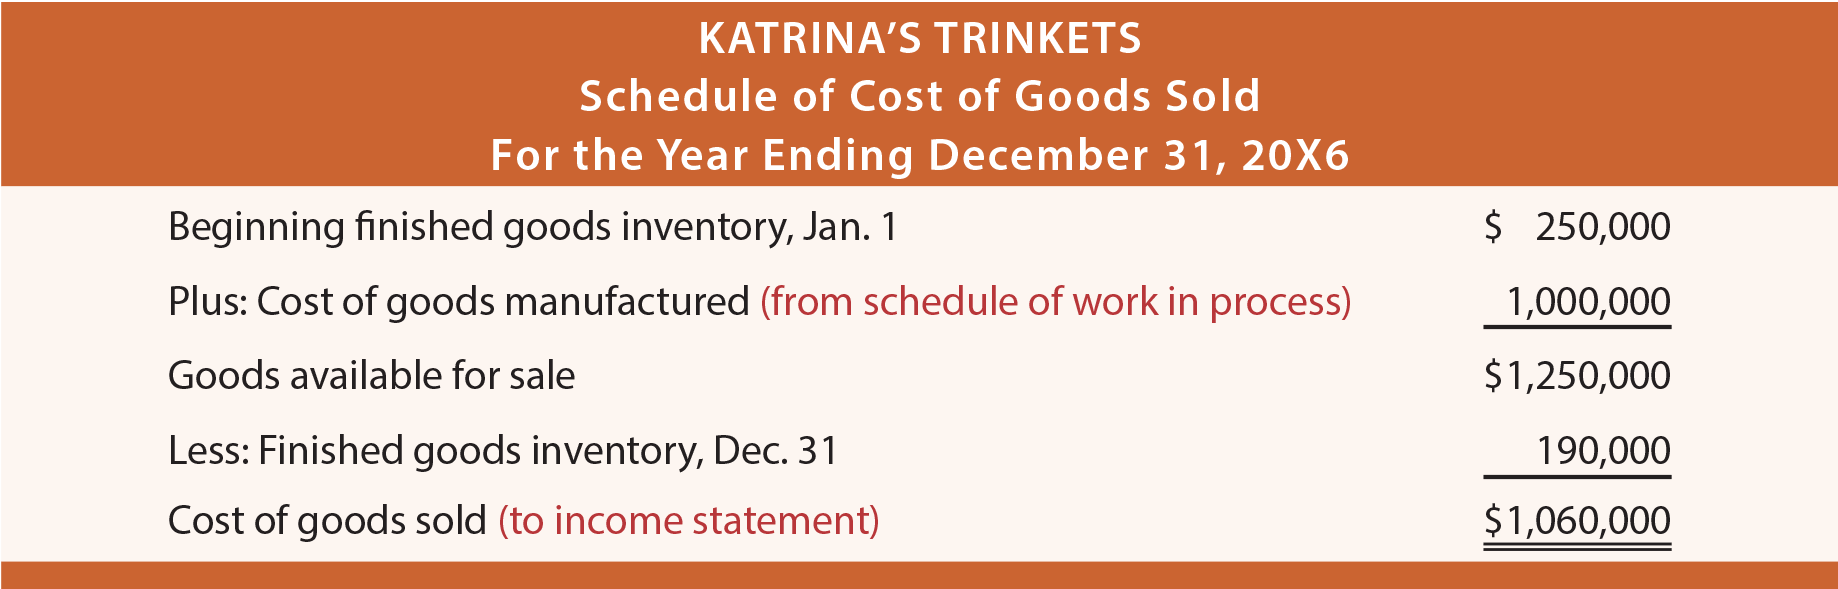
Schedule Of Cost Of Goods Sold
The determination of cost of goods sold is made via an examination of changes in finished goods:
The Income Statement
The cost of goods sold number within the income statement is taken from the preceding schedules, and is found in the income statement below.
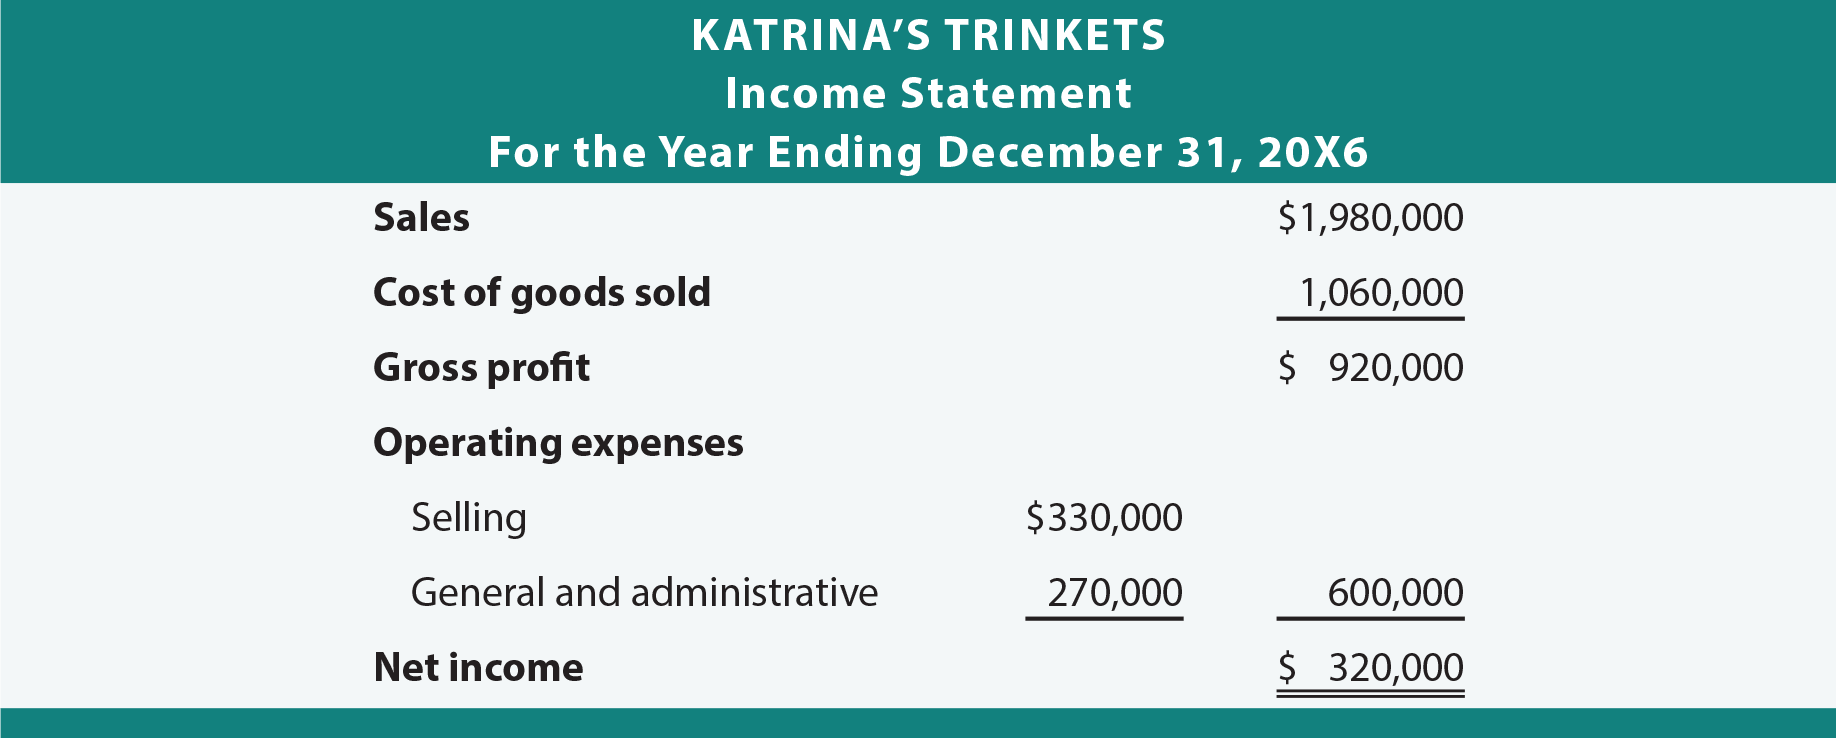
All of the supporting schedules that were presented leading up to the income statement are ordinarily “internal use only” type documents. The details are rarely needed by external financial statement users who focus on the income statement. In fact, some trade secrets could be lost by publicly revealing the level of detail found in the schedules. For example, a competitor may be curious to know the labor cost incurred in producing a product, or a customer may think that the finished product price is too high relative to the raw material cost.
Critical Thinking About Cost Flow
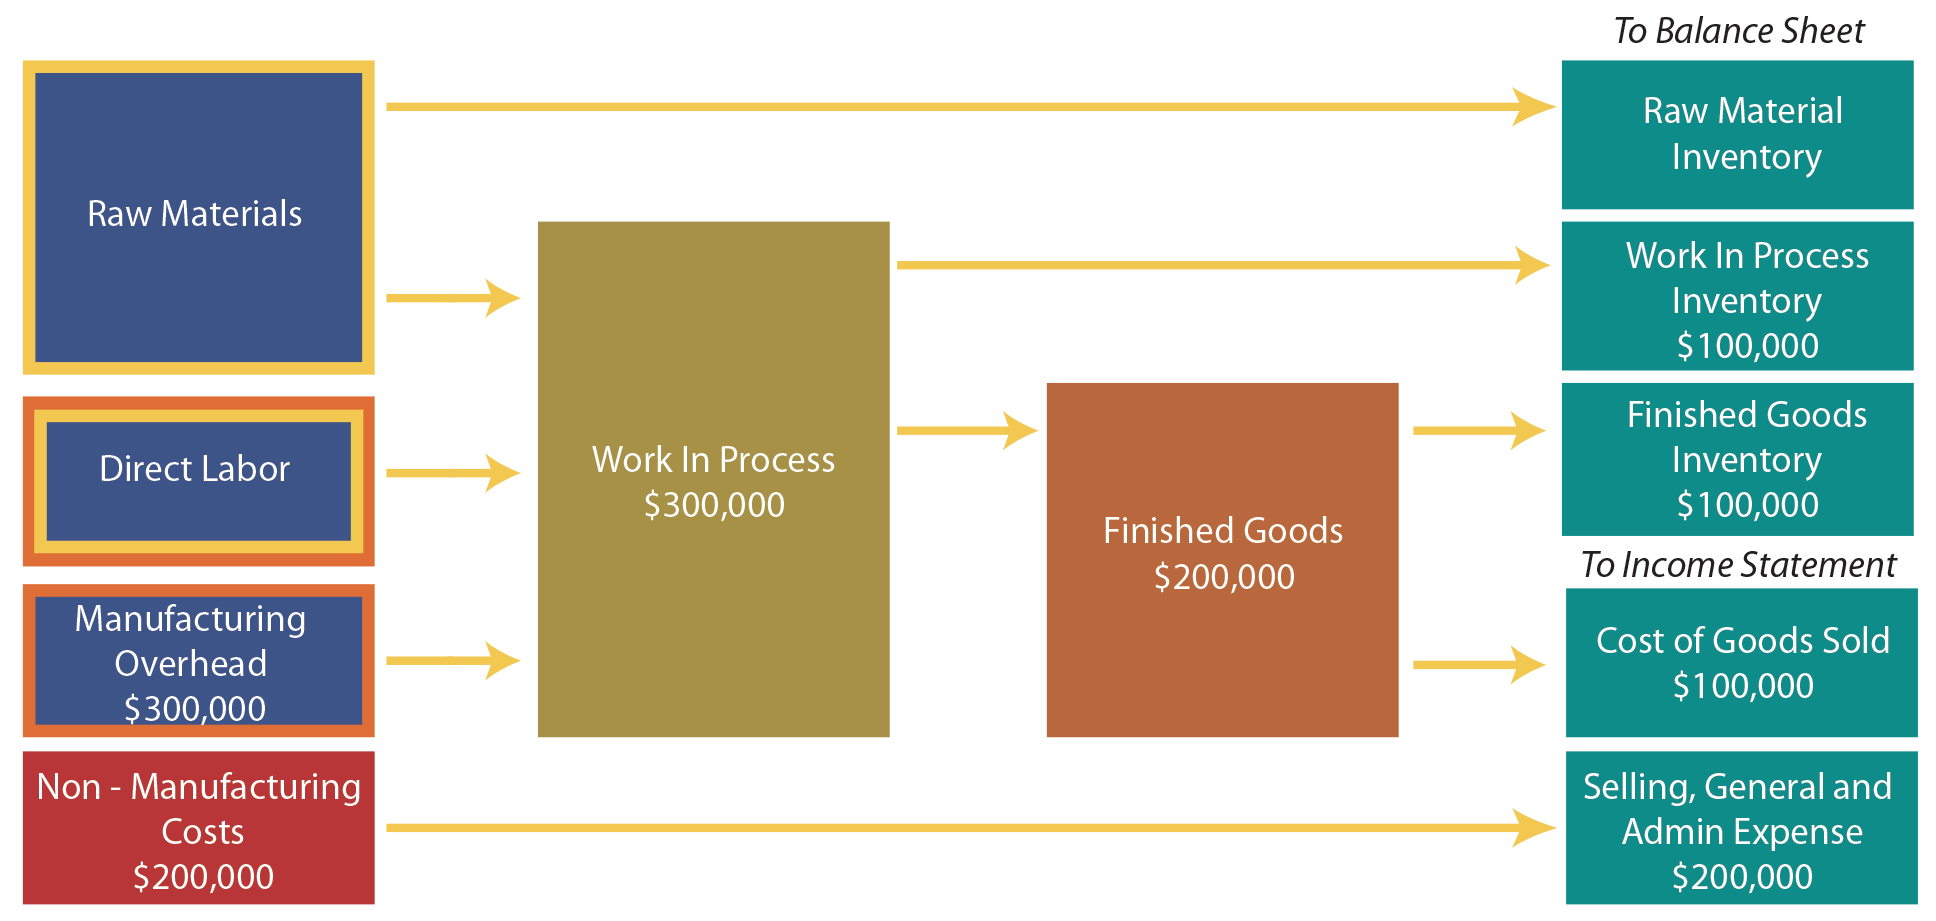
The following diagram summarizes the discussion thus far. Costs are listed on the left. “Product costs” are in blue boxes and the “period costs” are in the red box. Further, the “prime costs” have a yellow outline, while the “conversion costs” have an orange outline. Note that the direct labor box has both a yellow and orange outline; remember that it is both a prime and conversion cost.
It is easy to overlook an important aspect of cost flow within a manufacturing operation. As you review the diagram try to answer this seemingly simple question: Is depreciation an expense? One may be inclined to say yes. But, the fact of the matter is that the answer depends!
To prove the point suppose that Altec Corporation calculated total depreciation of $500,000 for 20X1. $300,000 of this depreciation pertained to the manufacturing plant, and $200,000 related to the corporate offices. Of the goods entered into production assume that one third remains in production, one third is finished awaiting resale, and one third was completed and sold. This results in the $300,000 of factory depreciation being allocated evenly to work in process inventory, finished goods inventory, and cost of goods sold.
The diagram notes how the $500,000 of depreciation cost flows to the balance sheet and income statement components. Be aware that the illustration only shows dollar amounts related to depreciation; clearly there would be many other costs to consider.
Returning to the seemingly simple question, notice that a cost is not always an expense. In a manufacturing business, much of the direct material, direct labor, and factory overhead can end up in inventory. How important are these cost flow concepts? They are important enough that the FASB has specified external reporting rules requiring the allocation of production overhead to inventory. And, for tax purposes, there are specific “uniform capitalization” rules. Under these rules, manufactured inventory must absorb direct labor, direct materials, and a myriad of indirect costs. A company’s results of operations are sensitive to proper cost assignment, and management accountants are focused on processes for correctly measuring this information.
| Did you learn? |
|---|
| Be able to prepare the financial statements of a manufacturer. |
| Note the special categories of inventory for a manufacturer. |
| Demonstrate the expanded nature of a manufacturer’s income statement. |
| Be able to calculate cost of goods manufactured. |
| Be able to diagram the cost flows within a manufacturing company. |