Cost structures can be anticipated to change over time. Management must carefully analyze these changes to manage profitability. CVP is useful for studying sensitivity of profit for shifts in fixed costs, variable costs, sales volume, and sales price.
Changing Fixed Costs
Changes in fixed costs are perhaps the easiest to analyze. To determine a revised break-even level requires that the new total fixed cost be divided by the contribution margin. Return to the example for Leyland Sports. Recall one of the original break-even calculations:
Break-Even Point in Sales = Total Fixed Costs / Contribution Margin Ratio
$2,000,000 = $1,200,000 / 0.60
If Leyland added a sales manager at a fixed salary of $120,000, the revised break-even would be:
$2,200,000 = $1,320,000 / 0.60
In this case, the fixed cost increased from $1,200,000 to $1,320,000, and sales must reach $2,200,000 to break even. This increase in break-even means that the manager needs to produce at least $200,000 of additional sales to justify his or her post.
Changing Variable Costs
In recruiting the new sales manager, Leyland became interested in an aggressive individual who was willing to take the post on a “4% of sales” commission-only basis. Let’s see how this would change the break-even point:
Break-Even Point in Sales = Total Fixed Costs / Contribution Margin Ratio
$2,142,857 = $1,200,000 / 0.56
This calculation uses the revised contribution margin ratio (60% – 4% = 56%), and produces a lower break-even point than with the fixed salary ($2,142,857 vs. $2,200,000). But, do not assume that a lower break-even defines the better choice! Consider that the lower contribution margin will “stick” no matter how high sales go. At the upper extremes, the total compensation cost will be much higher with the commission-based scheme. Following is a graph of commission cost versus salary cost at different levels of sales. Note that the commission begins to exceed the fixed salary at any point above $3,000,000 in sales. In fact, at $6,000,000 of sales, the manager’s compensation is twice as high if commissions are paid in lieu of the salary!
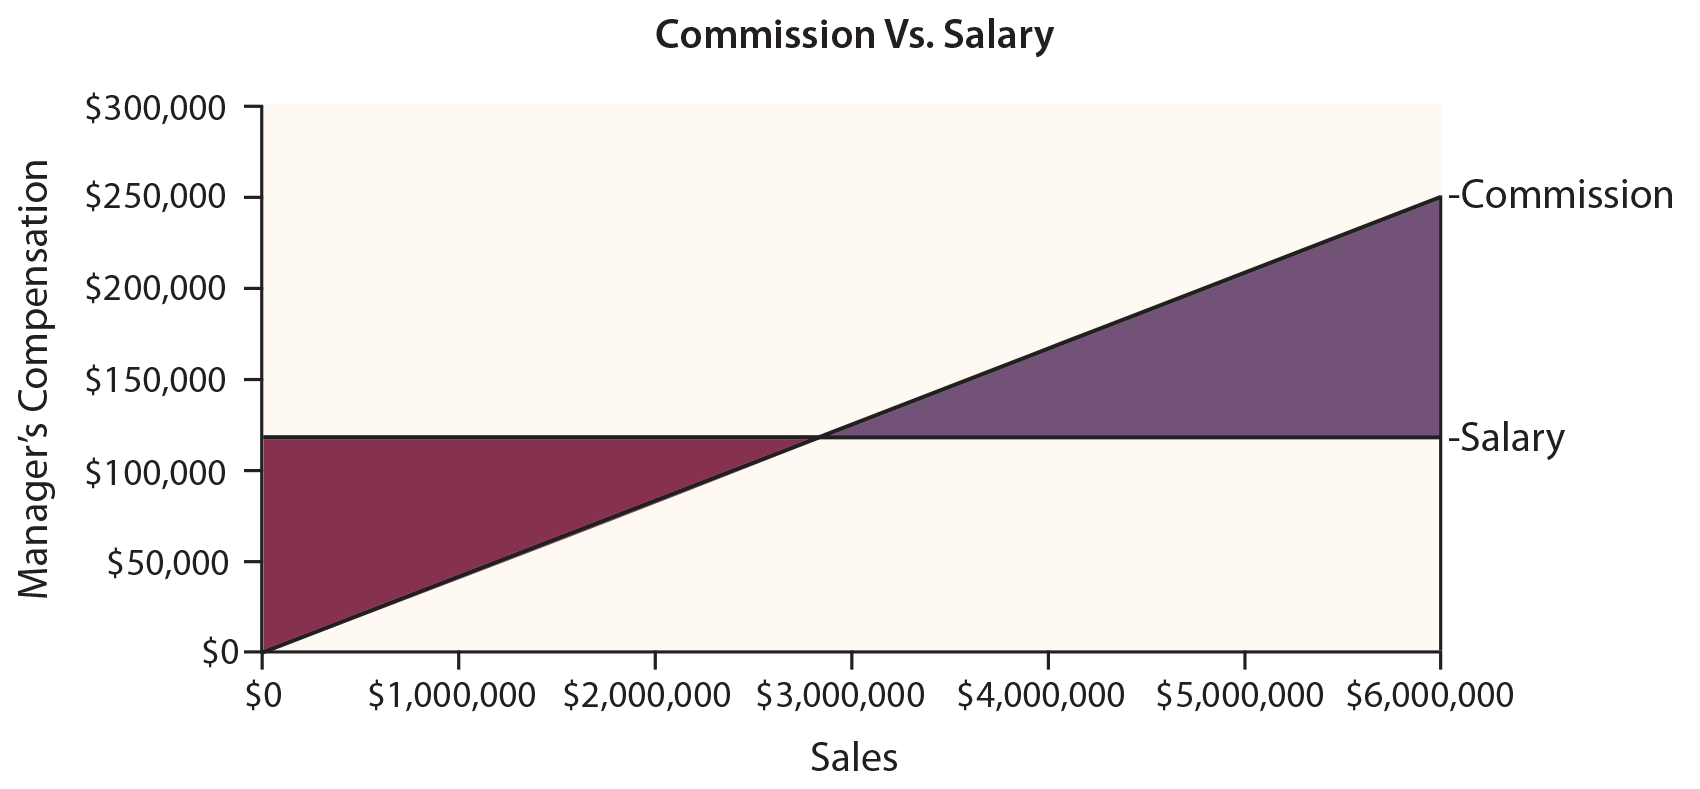
What this analysis does not reveal is how an individual will behave. The sales manager has more incentive to perform, and the added commission may be an excellent inducement. For example, the company will make more at $6,000,000 in sales than at $3,000,000 in sales, even if the sales manager is paid twice as much. At a fixed salary, it is hard to predict how well the manager will perform, since pay is not tied to performance.
Blended Cost Shifts
 Sometimes, a business will contemplate changes in fixed and variable costs. For example, an airline is considering the acquisition of a new jet. The new jet entails a higher fixed cost for the equipment, but is more fuel efficient.
The proper CVP analysis requires that the new fixed cost be divided by the new unit contribution margin to determine the new break-even level. Such analysis is important to evaluate whether an increase in fixed costs is justified.
To illustrate, assume Flynn Flying Service currently has a jet with a fixed operating cost of $3,000,000 per year, and a contribution margin of 30%. Flynn is offered an exchange for a new jet that will cost $4,000,000 per year to operate, but produce a 50% contribution margin. Flynn is expecting to produce $9,000,000 in revenue each year.
Should Flynn make the deal? The answer is yes. The break-even point on the old jet is $10,000,000 of revenue ($3,000,000/0.30), while the new jet has an $8,000,000 break-even ($4,000,000/0.50). At $9,000,000 of revenue, the new jet is profitable while continuing to use the old jet will result in a loss. The primary risk of this decision would relate to a significant drop off in volume, in which case Flynn would remain strapped with the $4,000,000 fixed cost.
Per Unit Revenue Shifts
Thus far, the discussion has focused on cost structure and changes to that structure. Another approach to changing the contribution margin is via changes in per unit selling prices. So long as these adjustments are made without impacting fixed costs, the results can be dramatic. Return to Leaping Lemming, and see how a 10% increase in sales price would impact the contribution margin and profitability for 20X2.
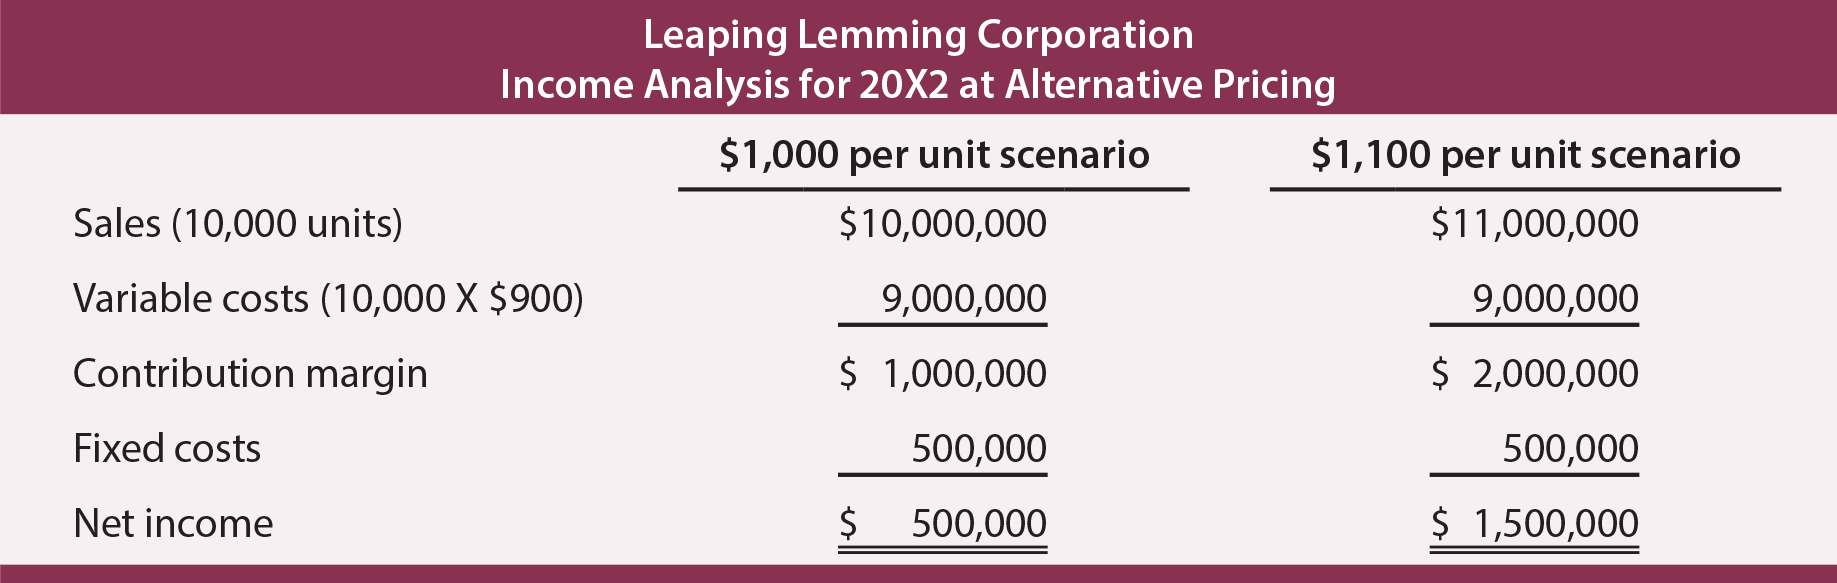
Notice that this 10% increase in price results in a doubling of the contribution margin and a tripling of the net income. The solution to increasing profits appears to be to raise prices while maintaining the existing cost structure. If only it were this easy!
Customers are sensitive to pricing and even a small increase can drive customers to competitors. Before raising prices, a company must consider the “price elasticity” of demand for its product. This is fancy jargon to describe the simple reality that demand for a product will drop as its price rises.
So, the real question for Leaping Lemming is to assess how much volume drop can be absorbed when prices are increased. The appropriate analysis requires dividing the continuing fixed costs (plus target or current net income) by the revised unit contribution margin. This calculation results in the required sales (in units) to maintain the current level of profitability.
For Lemming to achieve a $500,000 profit at the revised pricing level, it would need to sell 5,000 units:
Units to Achieve a Target Income = (Total Fixed Costs + Target Income) / Contribution Margin Per Unit
5,000 Units = ($500,000 + $500,000) / $200
If Lemming sells at least 5,000 units at $1,100 per unit, it will make at least as much as it would by selling 10,000 units at $1,000 per unit. The unknown is what customer response will be to the $1,100 pricing decision. It is possible that an increased price will reduce customer demand.
Margin Beware
Some contracts provide for “cost plus” pricing, or similar arrangements that seek to provide the seller with an assured margin. These agreements are intended to allow the seller a normal and fair profit margin, and no more. However, they can have unintended consequences.
For example, Pioneer Plastics sells trash bags to Heap Compacting Service. Heap and Pioneer have entered into an agreement that provides Pioneer with a contribution margin of 20% on 1,000,000 bags. Originally, the bags were anticipated to cost Pioneer $1 each to produce, plus a fixed cost of $100,000. However, increases in petroleum products necessary to produce the bags skyrocketed, and Pioneer’s variable production cost was actually $3 per unit. See how Pioneer fared under the agreement:
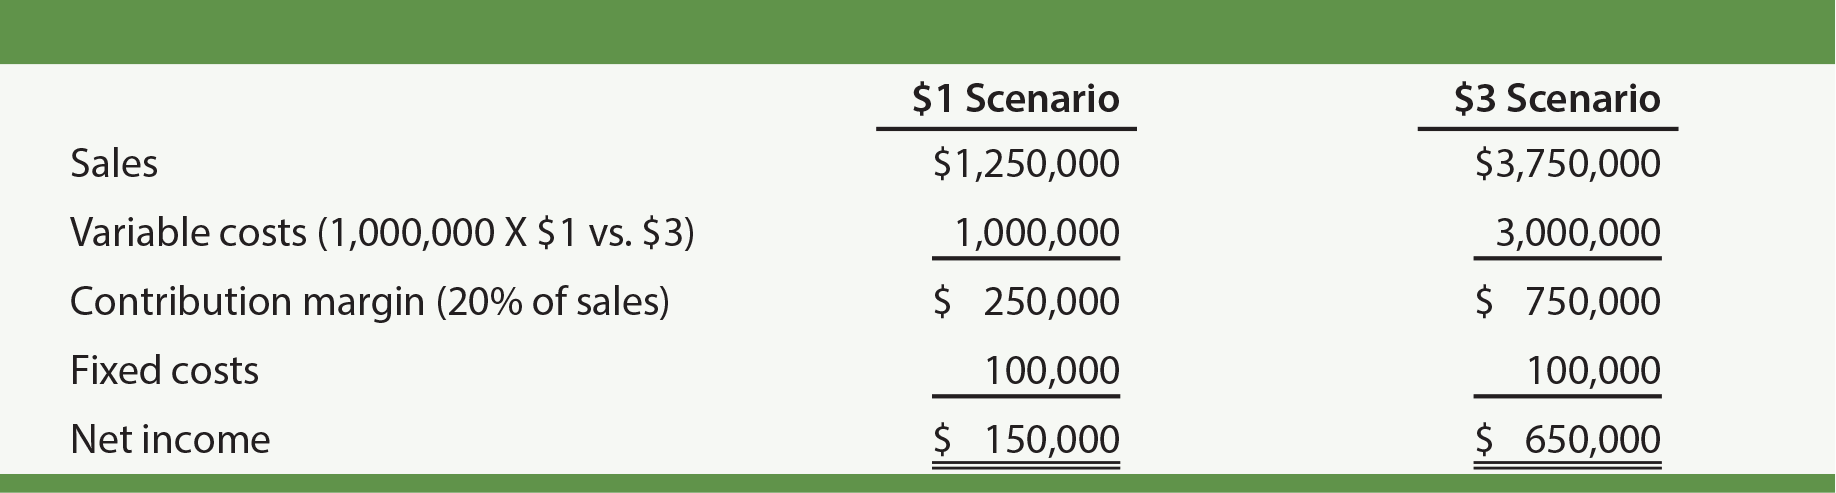
Notice the astounding change in Pioneer’s net income from $150,000 to $650,000. Such “cost plus” agreements must be carefully constructed, else the seller has little incentive to do anything but let costs creep up. Sometimes that company may complain about cost increases negatively affecting its margins. Before assuming the worst, take a closer look to see how the bottom line is being impacted. Even if Pioneer agreed to cut Heap a break and reduce the margin in half, Pioneer’s bottom line profit would still soar in the illustration.
Margin Math
In the illustration, the contribution margin was 20% of sales. Accordingly, variable costs are 80% of sales. If total variable costs were $1,000,000, then sales would be $1,250,000 ($1,000,000/0.80).
| Did you learn? |
|---|
| Understand the impact of operating changes on break-even and other CVP computations. |
| Be able to adjust CVP calculations for changes in fixed and variable costs. |
| Understand the income impacts of per unit revenue shifts. |