Closely look again at the 20X5 segment data for the illustrated company. In particular, note that the electrical segment produced operating income of $7,282,000. This compares to $9,556,000 for the galvanizing group. Even though the relative profitability changes a bit from year to year, the two units are not terribly far apart in overall profits. What is most interesting is that the electrical products segment deployed $79,424,000 in assets versus the $45,042,000 in use by galvanizing.
In this context, it is quite apparent that galvanizing is producing a better rate of return on the invested assets (i.e., fewer assets produced more income). A good manager would probably take note of this conclusion by careful inspection of the data. However, a managerial reporting technique, known as residual income, is sometimes used to expose these effects.
Residual income is not a GAAP concept. It is an internal financial assessment technique to help scale the relative success or failure of specific business activities. It adjusts income for a presumed cost of capital (or other threshold rate of return). Although there are many variations of the residual income calculations, the general approach is portrayed by the following formula:
Residual Income = Operating Income – (Operating Assets X Cost of Capital)
Case Study
For purposes of this illustration, assume that the company’s cost of capital (or minimum required rate of return) is 10%. The following table reveals calculations of the residual income for each segment.
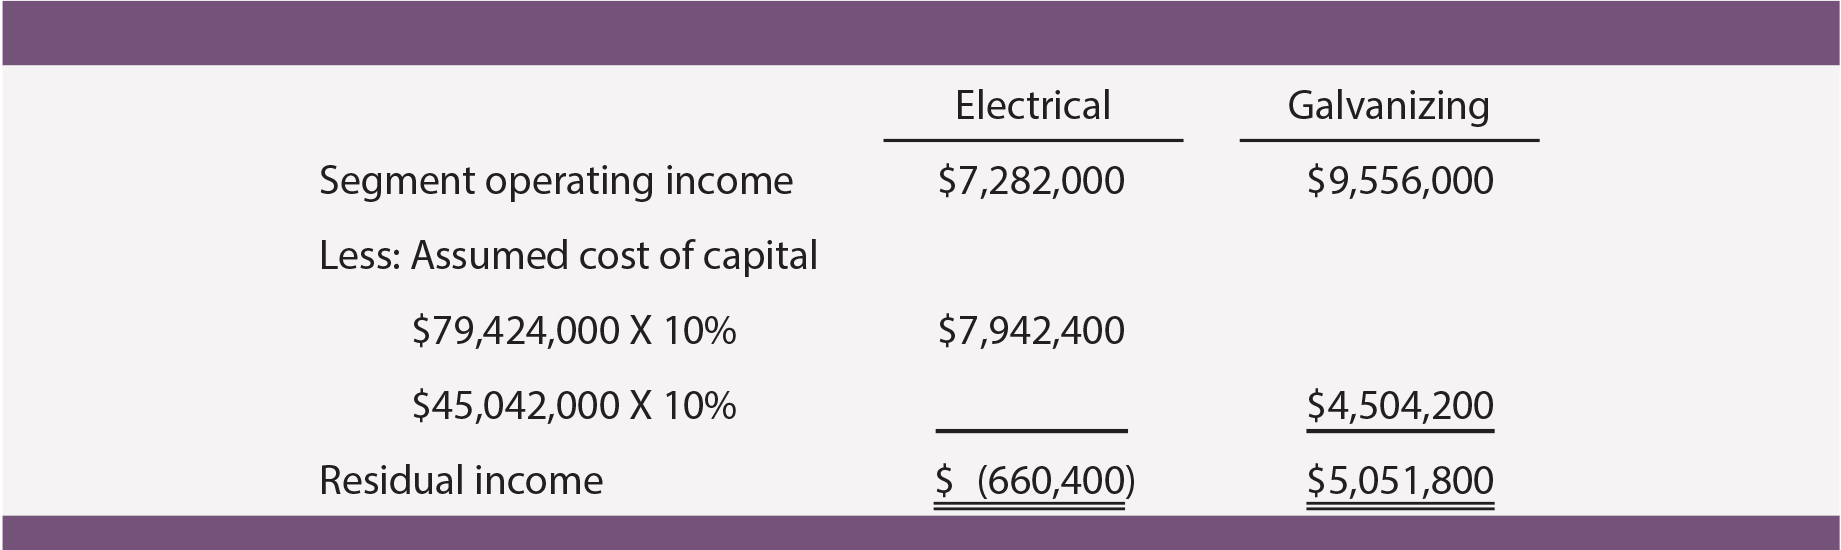
This information sheds a completely different light on the relative performance of each unit. Remember that the two units are not far apart in overall profitability. However, once the cost of capital is placed on the evaluative scale, it appears that the galvanizing unit is doing far better than the electrical unit. Residual income can be a powerful tool for identifying and ranking the performance of business units.
 Despite its benefits, one must be very careful in utilizing residual income. First, there is the usual issue of short run vs. long run considerations. The preceding illustration paints the electrical segment in a less favorable light than galvanizing; repeat the analysis using the 20X3 data, and the situation reverses. A single year’s residual income data is rarely conclusive in and of itself.
Second, managers need to be savvy to the impact of accounting rules. For instance, the electrical products segment may be investing heavily in research toward new products. These costs may be expensed, thereby substantially reducing operating income in current periods. As such, the unit’s residual income would suffer relative to other units that might be investing in tangible assets. Finally, the 10% rate is an arbitrary hurdle rate. Selecting an alternative rate will change the measure of residual income. Despite its inherent limitation, reports of residual income can be very helpful in clearly and quickly pinpointing areas of management concern.
| Did you learn? |
|---|
| Understand the concept of residual income and how it is calculated. |